

BTUDIBS ON THE INSECT PAUNA ON SCOTCH BROOM
165
t)uRhen onto a collecting tray. The egg numbers were obtained by disnectiorr8 of twoom twign of known weight. All the samples were related
fo the known quantity and weight of broom in the field, which was also
ecltimated twice year. Unfortunately our methods of sampling nymphs
proved to be unsatisfactory and only the maximum numbers are here
used tci denote the annual abundance of the nymphal and adult stages.
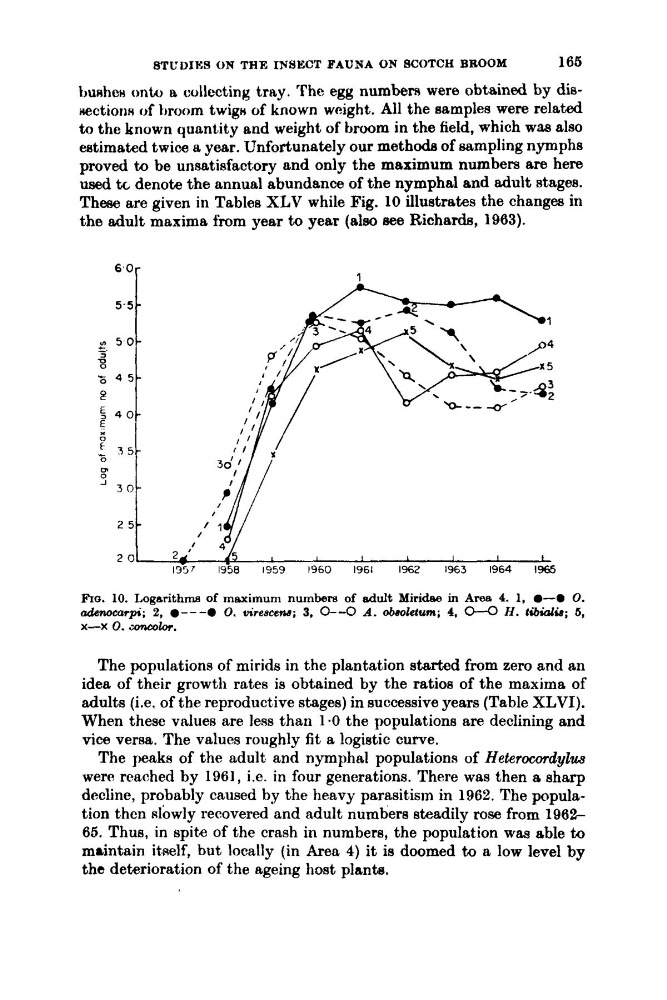
These are given in Tables XLV while Fig. 10 illustrates the changes in
the adult maxima from year to year (alm see Richards, 1963).
5.5 -
Lo
5 0 -
a
c
-.
U
4 5 -
?
1
FIG. 10. Logarithms of meximum numbers of adult Miridme in Area 4. 1. 0-0 0.
adenoearpi; 2, @---a 0. uitescena; 3. o--0 A . obwktum; 4, 0 - 0 H . tibidis; 6,
x-x 0. .7fmdor.
The populations of mirids in the plantation started from zero and an
idea of their growth rates is obtained by the ratios of the maxima of
adults (i.e. of the reproductive stages) in successive years (Table XLVI).
When these values are less than 1 .O the populations are declining and
vice versa. The values roughly fit a logistic curve.
The peaks of the adult and nymphal populations of Heterocordylw
were reached by 1961, i.e. in four generations. There was then 8 sharp
decline, probably caused by the heavy parasit,ism in 1962. The population then lowly recovered and adult numbers steadily rose from 196266. Thus, in spite of the crash in numbers, the population was able to
maintain it,self, but locally (in Area 4) it is doomed to a low level by
the deterioration of the ageing host plants.
165
t)uRhen onto a collecting tray. The egg numbers were obtained by disnectiorr8 of twoom twign of known weight. All the samples were related
fo the known quantity and weight of broom in the field, which was also
ecltimated twice year. Unfortunately our methods of sampling nymphs
proved to be unsatisfactory and only the maximum numbers are here
used tci denote the annual abundance of the nymphal and adult stages.
These are given in Tables XLV while Fig. 10 illustrates the changes in
the adult maxima from year to year (alm see Richards, 1963).
5.5 -
Lo
5 0 -
a
c
-.
U
4 5 -
?
1
FIG. 10. Logarithms of meximum numbers of adult Miridme in Area 4. 1. 0-0 0.
adenoearpi; 2, @---a 0. uitescena; 3. o--0 A . obwktum; 4, 0 - 0 H . tibidis; 6,
x-x 0. .7fmdor.
The populations of mirids in the plantation started from zero and an
idea of their growth rates is obtained by the ratios of the maxima of
adults (i.e. of the reproductive stages) in successive years (Table XLVI).
When these values are less than 1 .O the populations are declining and
vice versa. The values roughly fit a logistic curve.
The peaks of the adult and nymphal populations of Heterocordylw
were reached by 1961, i.e. in four generations. There was then 8 sharp
decline, probably caused by the heavy parasit,ism in 1962. The population then lowly recovered and adult numbers steadily rose from 196266. Thus, in spite of the crash in numbers, the population was able to
maintain it,self, but locally (in Area 4) it is doomed to a low level by
the deterioration of the ageing host plants.