

B T l i I ~ I E N ON T H E XXWECT FAIJNA ON SCOTCH BROOM
133
of sucwmivs instam. The velum ( p ) are unknown but can be found
from a wries of simultaneous equatione. These equations are reduced
by a method of leaet squares and then aolved. A further term (M) waa
inserteC for migration. A measure of migration was obtained from
catchee in the suction trap and the term (5) which was equal to no.
trapped between days o and tltotal no. trapped waa calculated.
M Z ~ , ~ )
in the equation gave the value end the sign of (M).
The regression method (Richards and Waloff, 1964) proved leas suitable for these data, as the population trends (curves) were flattened by
the overlapping stages.
The graphical method of analysis (Southwood, 1966), where the area
under the curve formed by the numbers of a stage on successive
sampling days is divided by the developmental period, was also tried.
The numbers of A. e p r t i i calculated by the three methods are given
in Table XXIV.
The results obtained for the smaller population of A. geniatue are too
variable to bo given in detail, but the peak numbers of all stages in
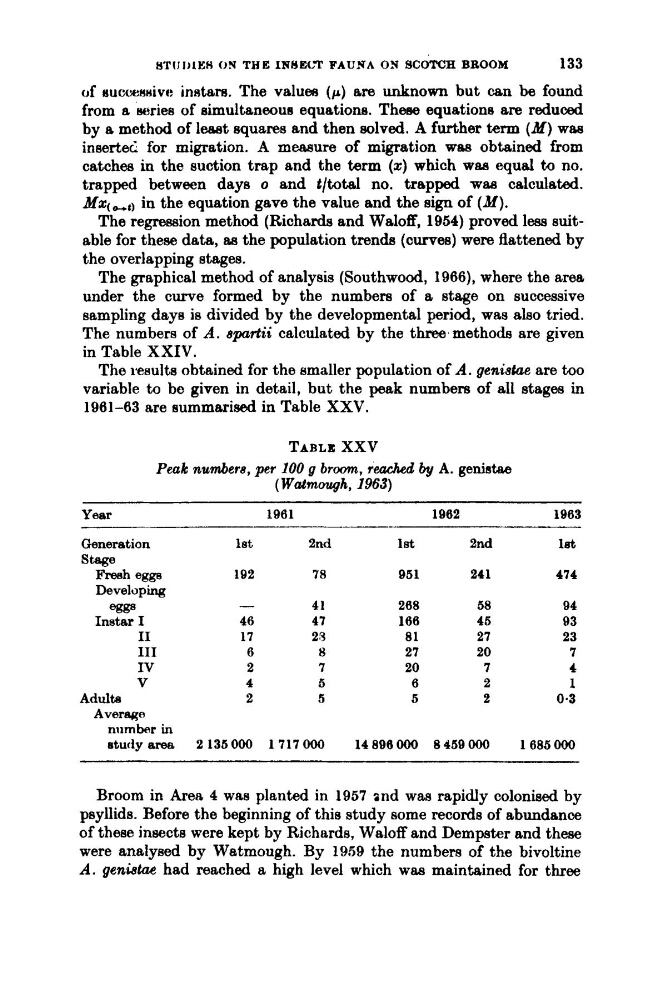
1961-63 are summarised in Table XXV.
TABLE XXV
Peak numbere, per 100 g broom, reuckd by A. geni8tes
( Watmough, 1963)
Year
1961
1962
1963
Generation
StSBe
Fresh egge
Developing
egga
Instar I
I1
I11
IV
V
Averago
Adulta
number in
etudy area
1st
192
-
46
17
6
2
4
2
2 135000
2nd
1st
78
951
41
268
47
166
23
81
8
27
7
20
5
6
5
5
1717000
14896000
2nd
24 1
58
45
27
20
7
2
2
8 459 OOO
let
474
94
93
23
7
4
1
0.3
1685 000
Broom in Area 4 was planted in 1957 2nd was rapidly colonieed by
psyllids. Before the beginning of this study some records of abundance
of these insects were kept by Richards, Waloff and Dempster and these
were andysed by Watmough. By 1959 the numbers of the bivoltine
A. genktae had reached a high level which waa maintained for three
133
of sucwmivs instam. The velum ( p ) are unknown but can be found
from a wries of simultaneous equatione. These equations are reduced
by a method of leaet squares and then aolved. A further term (M) waa
inserteC for migration. A measure of migration was obtained from
catchee in the suction trap and the term (5) which was equal to no.
trapped between days o and tltotal no. trapped waa calculated.
M Z ~ , ~ )
in the equation gave the value end the sign of (M).
The regression method (Richards and Waloff, 1964) proved leas suitable for these data, as the population trends (curves) were flattened by
the overlapping stages.
The graphical method of analysis (Southwood, 1966), where the area
under the curve formed by the numbers of a stage on successive
sampling days is divided by the developmental period, was also tried.
The numbers of A. e p r t i i calculated by the three methods are given
in Table XXIV.
The results obtained for the smaller population of A. geniatue are too
variable to bo given in detail, but the peak numbers of all stages in
1961-63 are summarised in Table XXV.
TABLE XXV
Peak numbere, per 100 g broom, reuckd by A. geni8tes
( Watmough, 1963)
Year
1961
1962
1963
Generation
StSBe
Fresh egge
Developing
egga
Instar I
I1
I11
IV
V
Averago
Adulta
number in
etudy area
1st
192
-
46
17
6
2
4
2
2 135000
2nd
1st
78
951
41
268
47
166
23
81
8
27
7
20
5
6
5
5
1717000
14896000
2nd
24 1
58
45
27
20
7
2
2
8 459 OOO
let
474
94
93
23
7
4
1
0.3
1685 000
Broom in Area 4 was planted in 1957 2nd was rapidly colonieed by
psyllids. Before the beginning of this study some records of abundance
of these insects were kept by Richards, Waloff and Dempster and these
were andysed by Watmough. By 1959 the numbers of the bivoltine
A. genktae had reached a high level which waa maintained for three