

STUDIES ON THE INSECT BAUNA ON SCOTCH BBOOM
131
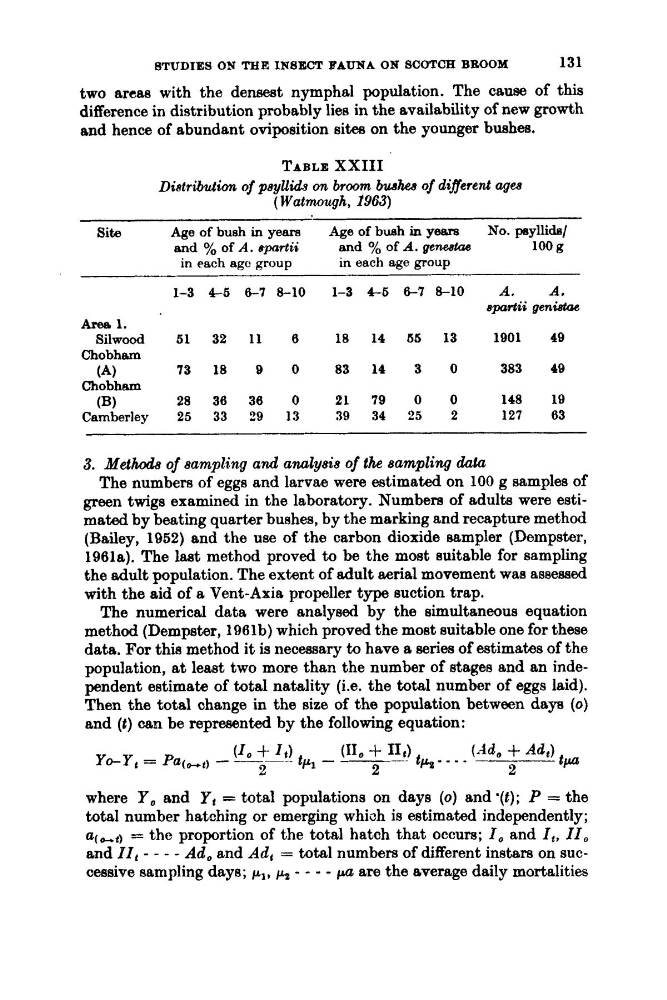
two areaa with the densest nymphal population. The cause of this
difference in distribution probably lies in the availability of new growth
and hence of abundant oviposition sites on the younger bushes.
TABLE XXIII
(Watmough, 1903)
Site
Age of bush in years
Age of bush in yeare
No. peyllidra/
Distribution of payUids on broom bwhea of &fleerent aga
a d yo of A . epartii
and yo of A . geneetas
100 8
in each ago group
in each ago group
1-3 P 5 6-7 8-10
1-3 4-6
6-7 8-10
A .
A ,
spa& genistac
Area 1.
Chobhem
Chobham
Camberley
25
33
29
13
39
34
25
2
Silwood
51
32
11
6
18
14
65
13
1901
49
(A)
73
I8
9
0
83
14
3
0
383
49
28
36
36
0
21
79
0
0
148
19
127
63
(B)
3. Methods of aarnpling and amlyais of the sampling data
The numbers of eggs and larvae were estimated on 100 g samples of
green twigs examined in the laboratory. Numbers of adults were estimated by beating quarter bushes, by the marking and recapture method
(Bailey, 1952) and the use of the carbon dioxide eampler (Dempster,
1961a). The laat method proved to be the most suitable for sampling
the adult population. The extent of adult aerial movement was assessed
with the aid of a Vent-Axia propeller type suction trap.
The numerical data were analysed by the simultaneous equation
method (Dempster, 196lb) which proved the most suitable one for these
data. For this method it is necessary to have B series of estimates of the
population, at least two more than the number of stages and an independent estimate of total natality (i.e. the total number of eggs laid).
Then the total change in the size of the population between days ( 0 )
and (t) can be represented by the following equation:
where Y o and Yt = total populations on days ( 0 ) and*(t); P = the
total number hatching or emerging which is estimated independently;
qbt) = the proportion of the total hatch that occurs; I, and I,, I I ,
and I I , - - - - Ad, and Ad, = total numbers of different instars on successive sampling days; pl, h - - - - pa are the average daily mortalities
131
two areaa with the densest nymphal population. The cause of this
difference in distribution probably lies in the availability of new growth
and hence of abundant oviposition sites on the younger bushes.
TABLE XXIII
(Watmough, 1903)
Site
Age of bush in years
Age of bush in yeare
No. peyllidra/
Distribution of payUids on broom bwhea of &fleerent aga
a d yo of A . epartii
and yo of A . geneetas
100 8
in each ago group
in each ago group
1-3 P 5 6-7 8-10
1-3 4-6
6-7 8-10
A .
A ,
spa& genistac
Area 1.
Chobhem
Chobham
Camberley
25
33
29
13
39
34
25
2
Silwood
51
32
11
6
18
14
65
13
1901
49
(A)
73
I8
9
0
83
14
3
0
383
49
28
36
36
0
21
79
0
0
148
19
127
63
(B)
3. Methods of aarnpling and amlyais of the sampling data
The numbers of eggs and larvae were estimated on 100 g samples of
green twigs examined in the laboratory. Numbers of adults were estimated by beating quarter bushes, by the marking and recapture method
(Bailey, 1952) and the use of the carbon dioxide eampler (Dempster,
1961a). The laat method proved to be the most suitable for sampling
the adult population. The extent of adult aerial movement was assessed
with the aid of a Vent-Axia propeller type suction trap.
The numerical data were analysed by the simultaneous equation
method (Dempster, 196lb) which proved the most suitable one for these
data. For this method it is necessary to have B series of estimates of the
population, at least two more than the number of stages and an independent estimate of total natality (i.e. the total number of eggs laid).
Then the total change in the size of the population between days ( 0 )
and (t) can be represented by the following equation:
where Y o and Yt = total populations on days ( 0 ) and*(t); P = the
total number hatching or emerging which is estimated independently;
qbt) = the proportion of the total hatch that occurs; I, and I,, I I ,
and I I , - - - - Ad, and Ad, = total numbers of different instars on successive sampling days; pl, h - - - - pa are the average daily mortalities