

DYNAMICS OF FIELD POPULATION OF P I N E LOOPER
377
I
1950/51
' 1952/55 ' 4951j55
' 195d157 ' W&/S
W&
I%;,k53
' IPG~/SI
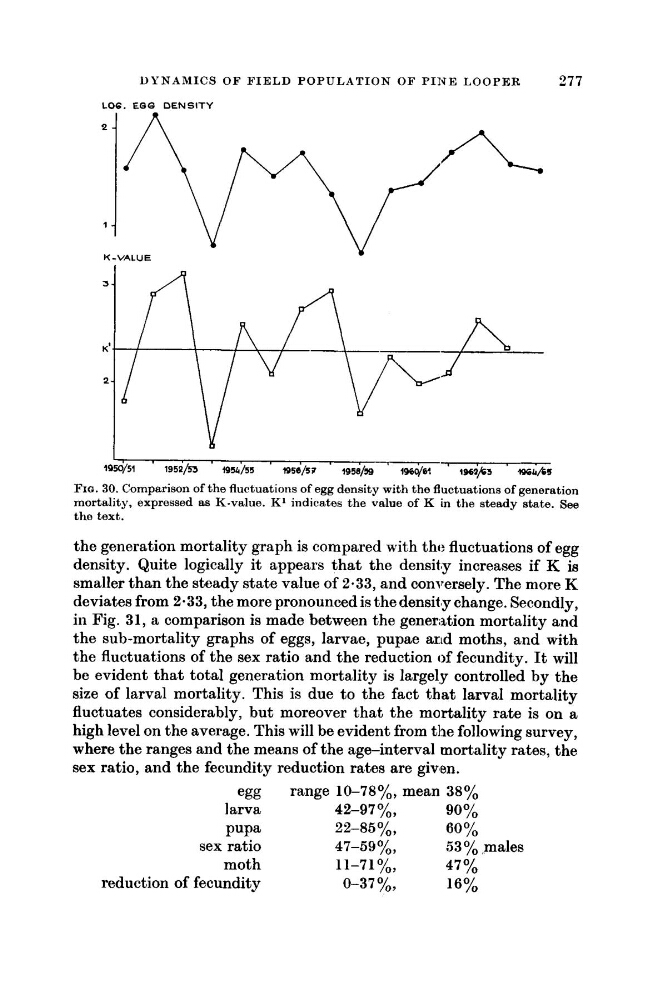
Fro. 30. Comparison of the fluctuations of egg density with the fluctuations of generation
mortality, expressed as K-value. K' indicates the value of K in the steady state. See
the text.
the generation mortality graph is compared with the fluctuations of egg
density. Quite logically it appears that the densitfy increases if K is
smaller than the steady state value of 2.33, and conversely. The more K
deviates from 2-33, the more pronounced is the densit'y change. Secondly,
in Fig. 31, a comparison is made between the generation mortality and
the sub-mortality graphs of eggs, larvae, pupae and moths, and with
the fluctuations of the sex ratio and the reduction of fecundity. It will
be evident that total generation mortality is largely controlled by the
size of larval mortality. This is due to the fact that larval mortality
fluctuates considerably, but moreover that the mortality rate is on a
high level on the average. This will be evident from the following survey,
where the ranges and the means of the age-interval mortality rates, the
sex ratio, and the fecundity reduction rates are given.
egg
range 10-78y0, mean 38%
1 arva
42-97y0,
90 Yo
Pupa
22-85 yo,
60 Y O
moth
11-71Y0,
47 %
reduction of fecundity
0-37 yo,
16%
sex ratio
47-59y0,
53% males
377
I
1950/51
' 1952/55 ' 4951j55
' 195d157 ' W&/S
W&
I%;,k53
' IPG~/SI
Fro. 30. Comparison of the fluctuations of egg density with the fluctuations of generation
mortality, expressed as K-value. K' indicates the value of K in the steady state. See
the text.
the generation mortality graph is compared with the fluctuations of egg
density. Quite logically it appears that the densitfy increases if K is
smaller than the steady state value of 2.33, and conversely. The more K
deviates from 2-33, the more pronounced is the densit'y change. Secondly,
in Fig. 31, a comparison is made between the generation mortality and
the sub-mortality graphs of eggs, larvae, pupae and moths, and with
the fluctuations of the sex ratio and the reduction of fecundity. It will
be evident that total generation mortality is largely controlled by the
size of larval mortality. This is due to the fact that larval mortality
fluctuates considerably, but moreover that the mortality rate is on a
high level on the average. This will be evident from the following survey,
where the ranges and the means of the age-interval mortality rates, the
sex ratio, and the fecundity reduction rates are given.
egg
range 10-78y0, mean 38%
1 arva
42-97y0,
90 Yo
Pupa
22-85 yo,
60 Y O
moth
11-71Y0,
47 %
reduction of fecundity
0-37 yo,
16%
sex ratio
47-59y0,
53% males