

DYNAMICS O F F I E L D POPULATION O F P I b - E L O O P E R
275
100 .
c 2 -
k
! i
8 -
g 2 0 -
0
I60 -
a
B. KEY-FACTOR ANALYSIS
99.5L
99.9
f , I ,I
90
1. Generation Mortality and Age-interval Mortalities
To study the factors responsible for the changes in population density
we adopted the key-factor method described by Varley and Gradwell
(1960). I n this method total generation mortality (K), occurring from
egg to moth stage, is compared with the suh-mortalities k,, k,, k, . . . . .)
occurring in definite time intervals or, as we did, in the successive stages
of the insect.
To make an inter-generation comparison possible, mortality cannot
be expressed as absolute numbers dying in the successive generations of
a definite stage, but must be given as a relative index. This can be done
in a meaningful way by taking the differences of the logarithms of the
densities occurring prior to and after the incidence of the mortality.
This is elucidated in Table XXIV, where the 19Ei9-60 generation is
treated in full detail. The absolute densities from which we proceeded
are given in the life tables. To facilitate the transfoymation of k-values
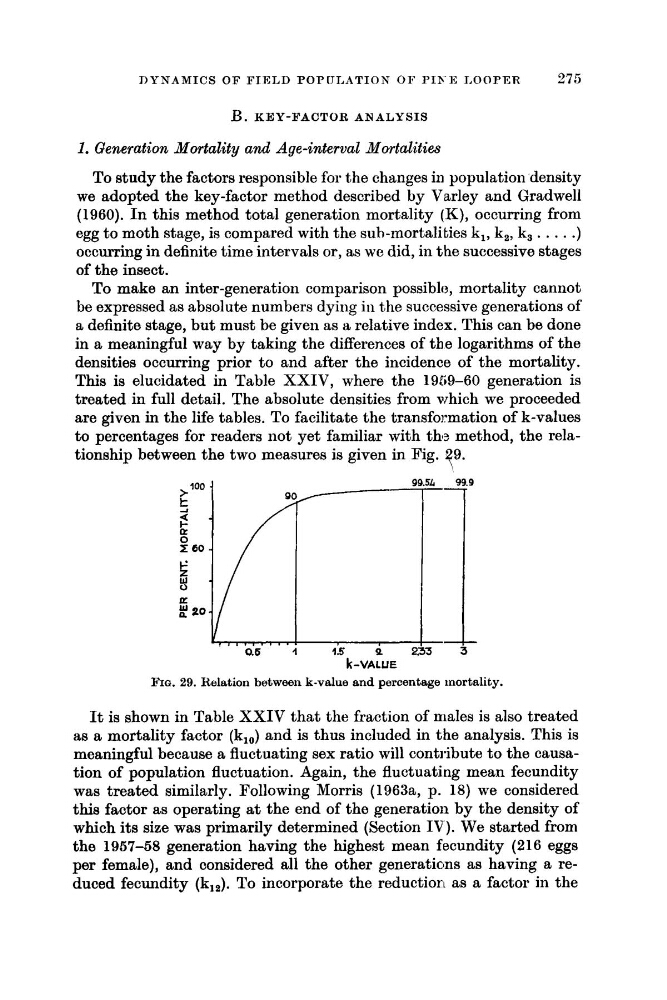
to percentages for readers not yet familiar with the method, the relationship between the two measures is given in Pig. .
T9
k-VALUE
FIQ. 29. Itelation between k-value and percentage mortality.
It is shown in Table XXIV that the fraction of males is also treated
as a mortality factor (k1J and is thus included in the analysis. This is
meaningful because a fluctua.ting sex ratio will contribute to the causation of population fluctuation. Again, the fluctuating mean fecundity
was treated similarly. Following Morris (1963a, p. 18) we considered
this factor as operating at the end of the generation by the density of
which its size was primarily determined (Section I V ) . We started from
the 1957-58 generation having the highest mean fecundity (216 eggs
per female), and considered all the other generations as having a reduced fecundity (k12). To incorporate the reduction as a factor in the
275
100 .
c 2 -
k
! i
8 -
g 2 0 -
0
I60 -
a
B. KEY-FACTOR ANALYSIS
99.5L
99.9
f , I ,I
90
1. Generation Mortality and Age-interval Mortalities
To study the factors responsible for the changes in population density
we adopted the key-factor method described by Varley and Gradwell
(1960). I n this method total generation mortality (K), occurring from
egg to moth stage, is compared with the suh-mortalities k,, k,, k, . . . . .)
occurring in definite time intervals or, as we did, in the successive stages
of the insect.
To make an inter-generation comparison possible, mortality cannot
be expressed as absolute numbers dying in the successive generations of
a definite stage, but must be given as a relative index. This can be done
in a meaningful way by taking the differences of the logarithms of the
densities occurring prior to and after the incidence of the mortality.
This is elucidated in Table XXIV, where the 19Ei9-60 generation is
treated in full detail. The absolute densities from which we proceeded
are given in the life tables. To facilitate the transfoymation of k-values
to percentages for readers not yet familiar with the method, the relationship between the two measures is given in Pig. .
T9
k-VALUE
FIQ. 29. Itelation between k-value and percentage mortality.
It is shown in Table XXIV that the fraction of males is also treated
as a mortality factor (k1J and is thus included in the analysis. This is
meaningful because a fluctua.ting sex ratio will contribute to the causation of population fluctuation. Again, the fluctuating mean fecundity
was treated similarly. Following Morris (1963a, p. 18) we considered
this factor as operating at the end of the generation by the density of
which its size was primarily determined (Section I V ) . We started from
the 1957-58 generation having the highest mean fecundity (216 eggs
per female), and considered all the other generations as having a reduced fecundity (k12). To incorporate the reduction as a factor in the