

DYNAMICS O F F I E L D POPULATION O F P I N E LOOPER
261
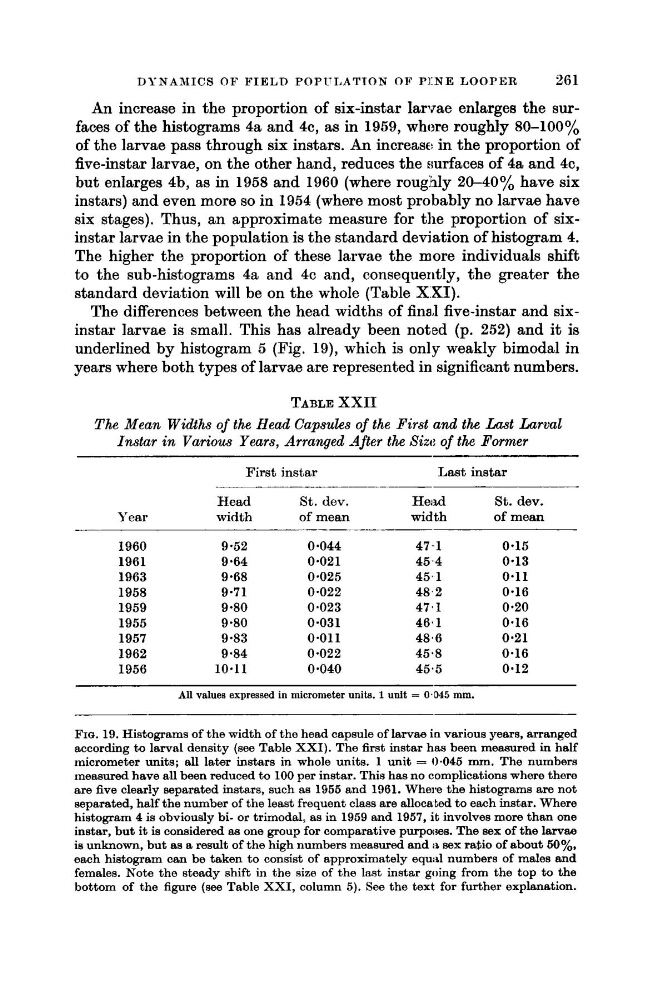
An increase in the proportion of six-instar larvae enlarges the surfaces of the histograms 4a and 40, as in 1959, where roughly 80-100~o
of the larvae pass through six instars. An increase in the proportion of
five-instar larvae, on the other hand, reduces the crurfaces of 4a and 4c,
but enlarges 4b, as in 1958 and 1960 (where roughly 20-40% have six
instars) and even more so in 1954 (where most probably no larvae have
six stages). Thus, an approximate measure for the proportion of sixinstar larvae in the population is the standard deviation of histogram 4.
The higher the proportion of these larvae the more individuals shift
to the sub-histograms 4a and 4c and, consequently, the greater the
standard deviation will be on the whole (Table XXI).
The differences between the head widths of final five-instar and sixinstar larvae is small. This has already been noted (p. 252) and it is
underlined by histogram 5 (Fig. 19), which is only weakly bimodal in
years where both types of larvae are represented in significant numbers.
TABLE XXII
The Mean Widths of the Head Capsules of the First and the Last Larval
Instur in Various Years, Arranged -4fter the Sizc: of the Pormer
First instar
Last instar
Head
St. dev.
H e i d
St. dev.
Year
width
of mean
width
of mean
1960
1961
1963
1958
1959
1955
1957
1962
1956
9 -52
9.64
9.68
9-71
9.80
9.80
9.83
9.84
10.11
0.044
0.021
0.025
0.022
0.023
0.031
0.01 1
0.022
0.040
47.,1
45 .-4
45.1
48.2
47.1
46.1
48.6
45.8
45.5
0.15
0.13
0.1 1
0.16
0.20
0.16
0.21
0.16
0.12
All values expressed in micrometer units. 1 unit = 0.045 mm.
FIG. 19. Histograms of the width of t.he head capsule of larvae in various years, arranged
according to larval density (see Table XXI). The first instar has been measured in half
micrometer units; all later instars in whole units. 1 unit = 0.045 mm. The numbers
measured have all been reduced to 100 per instar. This has no complications where there
are five clearly separated instars, such as 1955 and 1961. Where the histograms are not
separated, half the number of the least frequent class are allocated to each instar. Where
histogram 4 is obviously bi- or trimodal: as in 1959 and 1957, it involves more than one
instar, but it is considered as one group for comparative purpoijes. The sex of the larvae
is unknown, but as a result of the high numbers measured and i t sex ra$io of about 50%.
each histogram can be taken to consist of approximately equal numbers of males and
females. Note the steady shift in the size of the last instar going from the top to the
bottom of the figure (see Table XXI, column 5). See the text for further explanation.
261
An increase in the proportion of six-instar larvae enlarges the surfaces of the histograms 4a and 40, as in 1959, where roughly 80-100~o
of the larvae pass through six instars. An increase in the proportion of
five-instar larvae, on the other hand, reduces the crurfaces of 4a and 4c,
but enlarges 4b, as in 1958 and 1960 (where roughly 20-40% have six
instars) and even more so in 1954 (where most probably no larvae have
six stages). Thus, an approximate measure for the proportion of sixinstar larvae in the population is the standard deviation of histogram 4.
The higher the proportion of these larvae the more individuals shift
to the sub-histograms 4a and 4c and, consequently, the greater the
standard deviation will be on the whole (Table XXI).
The differences between the head widths of final five-instar and sixinstar larvae is small. This has already been noted (p. 252) and it is
underlined by histogram 5 (Fig. 19), which is only weakly bimodal in
years where both types of larvae are represented in significant numbers.
TABLE XXII
The Mean Widths of the Head Capsules of the First and the Last Larval
Instur in Various Years, Arranged -4fter the Sizc: of the Pormer
First instar
Last instar
Head
St. dev.
H e i d
St. dev.
Year
width
of mean
width
of mean
1960
1961
1963
1958
1959
1955
1957
1962
1956
9 -52
9.64
9.68
9-71
9.80
9.80
9.83
9.84
10.11
0.044
0.021
0.025
0.022
0.023
0.031
0.01 1
0.022
0.040
47.,1
45 .-4
45.1
48.2
47.1
46.1
48.6
45.8
45.5
0.15
0.13
0.1 1
0.16
0.20
0.16
0.21
0.16
0.12
All values expressed in micrometer units. 1 unit = 0.045 mm.
FIG. 19. Histograms of the width of t.he head capsule of larvae in various years, arranged
according to larval density (see Table XXI). The first instar has been measured in half
micrometer units; all later instars in whole units. 1 unit = 0.045 mm. The numbers
measured have all been reduced to 100 per instar. This has no complications where there
are five clearly separated instars, such as 1955 and 1961. Where the histograms are not
separated, half the number of the least frequent class are allocated to each instar. Where
histogram 4 is obviously bi- or trimodal: as in 1959 and 1957, it involves more than one
instar, but it is considered as one group for comparative purpoijes. The sex of the larvae
is unknown, but as a result of the high numbers measured and i t sex ra$io of about 50%.
each histogram can be taken to consist of approximately equal numbers of males and
females. Note the steady shift in the size of the last instar going from the top to the
bottom of the figure (see Table XXI, column 5). See the text for further explanation.