

258
a a -
Y
z 20-4
u
5
" 1
* . . *
0
.
i i
.
H . KLOMP
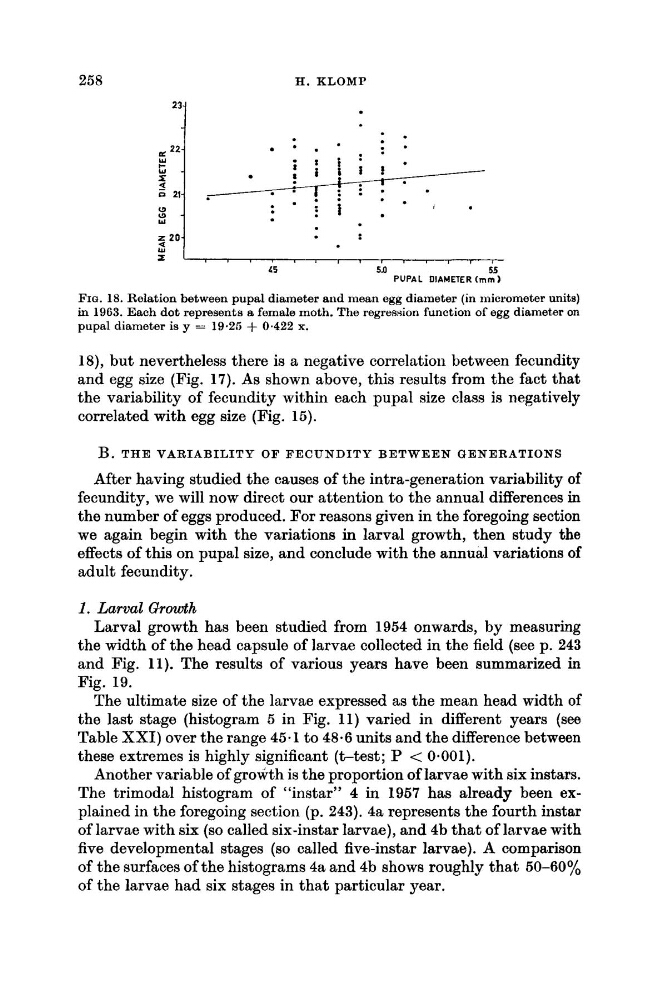
FIQ. 18. Relation between pupal diameter and mean egg diameter (in micrometer units)
i n 1963. Each dot represents a female moth. The regression function of egg diamet,er on
pupal diameter is y = 19.25 + 0.422 x.
18), but nevertheless there is a negative correlation between fecundity
and egg size (Fig. 17). As shown above, this results from the fact that
the variability of fecundity within each pupal size class is negatively
correlated with egg size (Fig. 15).
B. THE VARIABILITY OF FECUNDITY BETWEEN GENERATIONS
After having studied the causes of the intra-generation variability of
fecundity, we will now direct our attention to the annual differences in
the number of eggs produced. For reasons given in the foregoing section
we again begin with the variations in larval growth, then study the
effects of this on pupal size, and conclude with the annual variations of
adult fecundity.
1. Larval Growth
Larval growth has been studied from 1954 onwards, by measuring
the width of the head capsule of larvae collected in the field (see p. 243
and Fig. 11). The results of various years have been summarized in
Fig. 19.
The ultimate size of the larvae expressed as the mean head width of
the last stage (histogram 5 in Fig. 11) varied in different years (see
Table XXI) over the range 45-1 to 48.6 units and the difference between
these extremes is highly significant (t-test; P < 0.001).
Another variable of growth is the proportion of larvae with six instars.
The trimodal histogram of "instar" 4 in 1957 has already been explained in the foregoing section (p. 243). 4a represents the fourth instar
of larvae with six (so called six-instar larvae), and 4b that of larvae with
five developmental stages (so called five-instar larvae). A comparison
of the surfaces of the histograms 4a and 4b shows roughly that 50-60%
of the larvae had six stages in that particular year.
a a -
Y
z 20-4
u
5
" 1
* . . *
0
.
i i
.
H . KLOMP
FIQ. 18. Relation between pupal diameter and mean egg diameter (in micrometer units)
i n 1963. Each dot represents a female moth. The regression function of egg diamet,er on
pupal diameter is y = 19.25 + 0.422 x.
18), but nevertheless there is a negative correlation between fecundity
and egg size (Fig. 17). As shown above, this results from the fact that
the variability of fecundity within each pupal size class is negatively
correlated with egg size (Fig. 15).
B. THE VARIABILITY OF FECUNDITY BETWEEN GENERATIONS
After having studied the causes of the intra-generation variability of
fecundity, we will now direct our attention to the annual differences in
the number of eggs produced. For reasons given in the foregoing section
we again begin with the variations in larval growth, then study the
effects of this on pupal size, and conclude with the annual variations of
adult fecundity.
1. Larval Growth
Larval growth has been studied from 1954 onwards, by measuring
the width of the head capsule of larvae collected in the field (see p. 243
and Fig. 11). The results of various years have been summarized in
Fig. 19.
The ultimate size of the larvae expressed as the mean head width of
the last stage (histogram 5 in Fig. 11) varied in different years (see
Table XXI) over the range 45-1 to 48.6 units and the difference between
these extremes is highly significant (t-test; P < 0.001).
Another variable of growth is the proportion of larvae with six instars.
The trimodal histogram of "instar" 4 in 1957 has already been explained in the foregoing section (p. 243). 4a represents the fourth instar
of larvae with six (so called six-instar larvae), and 4b that of larvae with
five developmental stages (so called five-instar larvae). A comparison
of the surfaces of the histograms 4a and 4b shows roughly that 50-60%
of the larvae had six stages in that particular year.