

256
20H. KLOMP
.
* .
. . . .
* .
I
PUPAL D I A V E T E R
L . b m m
P z 0.06
“Z 21 130 150 170 190 210 230 250 270
204.7mm
P = 0.03
LSmm
.
*
. P z 0.01
. .
K
W
1
IiO
150
170
190 ’ 210
230
230
270
l 9
W
W
*I 21
P = 0.60
0
.
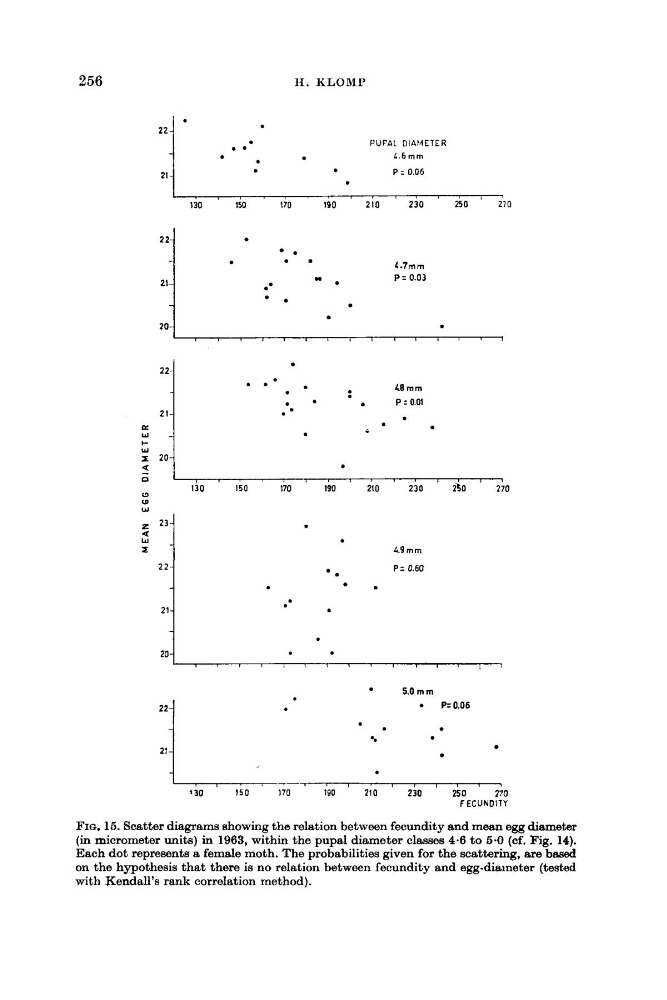
FIQ. 16. Scatter diagrams showing the relation between fecundity and mean egg diameter
(in micrometer units) in 1963, within the pupal diameter classes 4.6 to 5.0 (cf. Fig. 14).
Each dot represents a female moth. The probabilities given for the scattering, are b d
on the hypothesis that there is no relation between fecundity and eggdiaineter (tested
with Kendall’s rank correlation method).
20H. KLOMP
.
* .
. . . .
* .
I
PUPAL D I A V E T E R
L . b m m
P z 0.06
“Z 21 130 150 170 190 210 230 250 270
204.7mm
P = 0.03
LSmm
.
*
. P z 0.01
. .
K
W
1
IiO
150
170
190 ’ 210
230
230
270
l 9
W
W
*I 21
P = 0.60
0
.
FIQ. 16. Scatter diagrams showing the relation between fecundity and mean egg diameter
(in micrometer units) in 1963, within the pupal diameter classes 4.6 to 5.0 (cf. Fig. 14).
Each dot represents a female moth. The probabilities given for the scattering, are b d
on the hypothesis that there is no relation between fecundity and eggdiaineter (tested
with Kendall’s rank correlation method).