

230
H . KLOMP
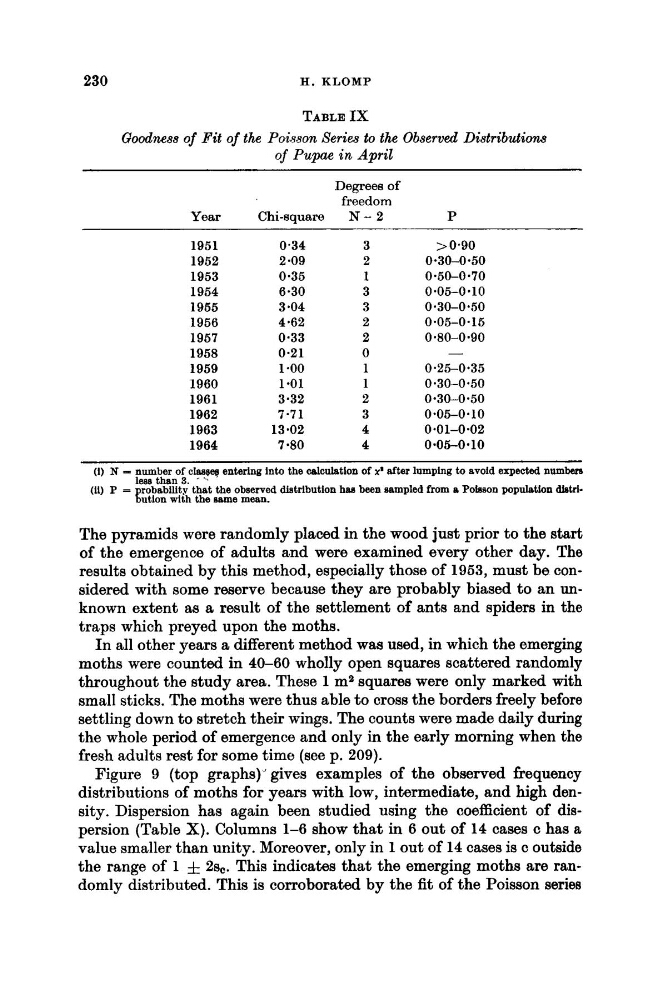
TABLE IX
Goodness of Fit of the Poisson Series to the Observed Distributions
of Pupae in April
Degrees of
freedom
Year
Chi-square
N - 2
P
1951
1952
1953
1954
1965
1956
1957
1958
1959
1960
1961
1962
1963
1964
0.34
2 -09
0.35
6.30
3 *04
4 *62
0.33
0.21
1 -00
1.01
3.32
7.71
13.02
7.80
3
2
1
3
3
2
2
0
1
1
2
3
4
4
> 0.90
0.30-0.50
0.50-0.70
0.30-0.50
0 *05-0 '1 0
0.05-0.1 5
0.80-0.90
-
0-25-0.35
0.30-0.50
0.30-0.50
0.05-0.10
0.01-0.02
0.05-0*10
(1) N - number of c l a y entering into the calculation of x' after lumping to avoid expected number8
(11) P - g robability that the observed distribution hss been sampled from a Polsson population dtstrllees than 3. .
ution with the same mean.
The pyramids were randomly placed in the wood just prior to the start
of the emergence of adults and were examined every other day. The
results obtained by this method, especially those of 1953, must be considered with some reserve because they are probably biased to an unknown extent as a result of the settlement of ants and spiders in the
traps which preyed upon the moths.
In all other years a different method was used, in which the emerging
moths were counted in 40-60 wholly open squares scattered randomly
throughout the study area. These 1 ma squares were only marked with
small sticks. The moths were thus able to cross the borders freely before
settling down to stretch their wings. The counts were made daily during
the whole period of emergence and only in the early morning when the
fresh adults rest for some time (see p. 209).
Figure 9 (top graphs)"gives examples of the observed frequency
distributions of moths for years with low, intermediate, and high density. Dispersion has again been studied using the coefficient of dispersion (Table X). Columns 1-6 show that in 6 out of 14 cases c has a
value smaller than unity. Moreover, only in 1 out of 14 cases is c outside
the range of 1 f 2s,. This indicates that the emerging moths are randomly distributed. This is corroborated by the fit of the Poisson series
H . KLOMP
TABLE IX
Goodness of Fit of the Poisson Series to the Observed Distributions
of Pupae in April
Degrees of
freedom
Year
Chi-square
N - 2
P
1951
1952
1953
1954
1965
1956
1957
1958
1959
1960
1961
1962
1963
1964
0.34
2 -09
0.35
6.30
3 *04
4 *62
0.33
0.21
1 -00
1.01
3.32
7.71
13.02
7.80
3
2
1
3
3
2
2
0
1
1
2
3
4
4
> 0.90
0.30-0.50
0.50-0.70
0.30-0.50
0 *05-0 '1 0
0.05-0.1 5
0.80-0.90
-
0-25-0.35
0.30-0.50
0.30-0.50
0.05-0.10
0.01-0.02
0.05-0*10
(1) N - number of c l a y entering into the calculation of x' after lumping to avoid expected number8
(11) P - g robability that the observed distribution hss been sampled from a Polsson population dtstrllees than 3. .
ution with the same mean.
The pyramids were randomly placed in the wood just prior to the start
of the emergence of adults and were examined every other day. The
results obtained by this method, especially those of 1953, must be considered with some reserve because they are probably biased to an unknown extent as a result of the settlement of ants and spiders in the
traps which preyed upon the moths.
In all other years a different method was used, in which the emerging
moths were counted in 40-60 wholly open squares scattered randomly
throughout the study area. These 1 ma squares were only marked with
small sticks. The moths were thus able to cross the borders freely before
settling down to stretch their wings. The counts were made daily during
the whole period of emergence and only in the early morning when the
fresh adults rest for some time (see p. 209).
Figure 9 (top graphs)"gives examples of the observed frequency
distributions of moths for years with low, intermediate, and high density. Dispersion has again been studied using the coefficient of dispersion (Table X). Columns 1-6 show that in 6 out of 14 cases c has a
value smaller than unity. Moreover, only in 1 out of 14 cases is c outside
the range of 1 f 2s,. This indicates that the emerging moths are randomly distributed. This is corroborated by the fit of the Poisson series