

DYNAMICS OF FIELD POPULATION O F P I N E LOOPER
229
10
2 > u W 3 ? 5 0 1
e
(L
1 0
:i 5 C
1 1 2
0.12/SO.M.
0
'Ol
2 . 4 6 8
0 2 I
6
8 1 0 1 2 1 4
PUPAE PER SQ.M.
PUPAE PER SP.M.
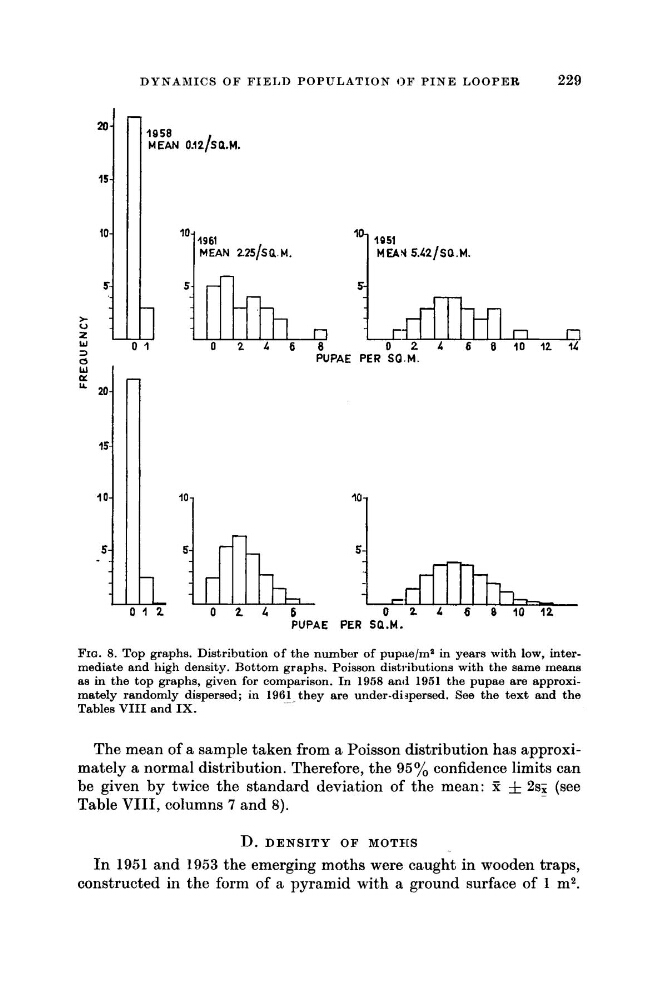
FIG. 8. Top graphs. Distribution of the number of pupite/m* i n years with low, intermediate and high density. Bottom graphs. Poisson distributions with the same means
as i n the top graphs, given for comparison. In 1958 and 1951 the pupae are approximately randomly dispersed; in 1961- they are under-digpersed. See the text and the
Tables VIII and IX.
The mean of a sample taken from a Poisson distribution has approximately a normal distribution. Therefore, the 95% confidence limits can
be given by twice the standard deviation of the mean: Z & 292 - (see
Table VIII, columns 7 and 8).
D. D E N S I T Y O F MOTHS
In 1951 and 1953 the emerging moths were caught in wooden traps,
constructed in the form of a pyramid with a ground surface of 1 m2.
229
10
2 > u W 3 ? 5 0 1
e
(L
1 0
:i 5 C
1 1 2
0.12/SO.M.
0
'Ol
2 . 4 6 8
0 2 I
6
8 1 0 1 2 1 4
PUPAE PER SQ.M.
PUPAE PER SP.M.
FIG. 8. Top graphs. Distribution of the number of pupite/m* i n years with low, intermediate and high density. Bottom graphs. Poisson distributions with the same means
as i n the top graphs, given for comparison. In 1958 and 1951 the pupae are approximately randomly dispersed; in 1961- they are under-digpersed. See the text and the
Tables VIII and IX.
The mean of a sample taken from a Poisson distribution has approximately a normal distribution. Therefore, the 95% confidence limits can
be given by twice the standard deviation of the mean: Z & 292 - (see
Table VIII, columns 7 and 8).
D. D E N S I T Y O F MOTHS
In 1951 and 1953 the emerging moths were caught in wooden traps,
constructed in the form of a pyramid with a ground surface of 1 m2.