

DYNAMICS O F FIELD POPULATION’ O F PINE LOOPER
227
dug out and moss and litter are spread on a cloth in small quantities
and examined carefully. The litter is then piit back into the square and
covered with moss, which recovers within one to two months. The 24
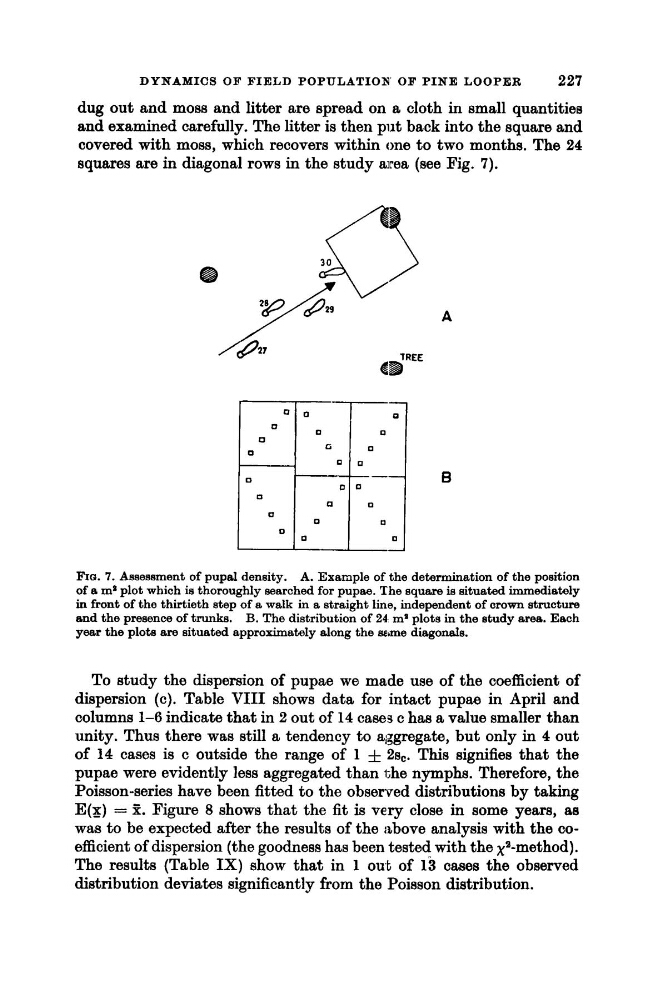
squares are in diagonal rows in the study area (see Fig. 7).
! -I
FIG. 7. Assessment of uuual densitv.
0
B
A. Exanule of the determination of the uosition
of a ma plot which is tiorbughly eeirched for pupae. The square is situated immediately
in front of the thirtieth step of a walk i n a straight line, independent of crown structure
and the presence of trunks. B. The distribution of 24 m* plots in the study area. Each
year the plots are situated approximately along the mme diagonals.
To study the dispersion of pupae we made use of the coefficient of
dispersion (c). Table VIII shows data for intact pupae in April and
columns 1-6 indicate that in 2 out of 14 cases c has a value smaller than
unity. Thus there was still a tendency to aggregate, but only in 4 out
of 14 cases is c outside the range of 1 f 25,. This signifies that the
pupae were evidently less aggregated than i;he nymphs. Therefore, the
Poisson-series have been fitted to the observed distributions by taking
E(x) = S. Figure 8 shows that the fit is very close in some years, as
was to be expected after the results of the above analysis with the coefficient of dispersion (the goodness has been tested with the Xa-method).
The results (Table IX) show that in 1 out of 13 cases the observed
distribution deviates significantly from the Poisson distribution.
227
dug out and moss and litter are spread on a cloth in small quantities
and examined carefully. The litter is then piit back into the square and
covered with moss, which recovers within one to two months. The 24
squares are in diagonal rows in the study area (see Fig. 7).
! -I
FIG. 7. Assessment of uuual densitv.
0
B
A. Exanule of the determination of the uosition
of a ma plot which is tiorbughly eeirched for pupae. The square is situated immediately
in front of the thirtieth step of a walk i n a straight line, independent of crown structure
and the presence of trunks. B. The distribution of 24 m* plots in the study area. Each
year the plots are situated approximately along the mme diagonals.
To study the dispersion of pupae we made use of the coefficient of
dispersion (c). Table VIII shows data for intact pupae in April and
columns 1-6 indicate that in 2 out of 14 cases c has a value smaller than
unity. Thus there was still a tendency to aggregate, but only in 4 out
of 14 cases is c outside the range of 1 f 25,. This signifies that the
pupae were evidently less aggregated than i;he nymphs. Therefore, the
Poisson-series have been fitted to the observed distributions by taking
E(x) = S. Figure 8 shows that the fit is very close in some years, as
was to be expected after the results of the above analysis with the coefficient of dispersion (the goodness has been tested with the Xa-method).
The results (Table IX) show that in 1 out of 13 cases the observed
distribution deviates significantly from the Poisson distribution.