

226
H. KLOYP
TABLE VI
Goodness of Fit for the Negative Binomial to the Obeerved Distributions
of Descending Nymphs
Degrees of
freedom
Year
Chi-square
N - 3
P
1963
1964
1966
1966
1967
1968
1969
1960
1961
1962
1963
1964
0-78
0-48
2.96
1-34
0.96
2.22
1-17
2.34
1.12
3-82
9-76
0.50
1
2
1
2
0
1
1
2
3
4
4
1
0-30-0*60
0*70-0*80
0*06-0~10 '
0-60-0.70
0.10-0.20
0-20-0-30
0-30-0.60
0.70-0.80
0.30-0-60
0.30-0*60
-
0.02-0.06
(1) N = number of claasea entering into the calculation of xE after lumping to avoid expected numbers
(ii) P = probabilit that the observed distribution haa been sampled from a negative binomial pop.&
less than 8.
tion distrliution with the same mean and variance.
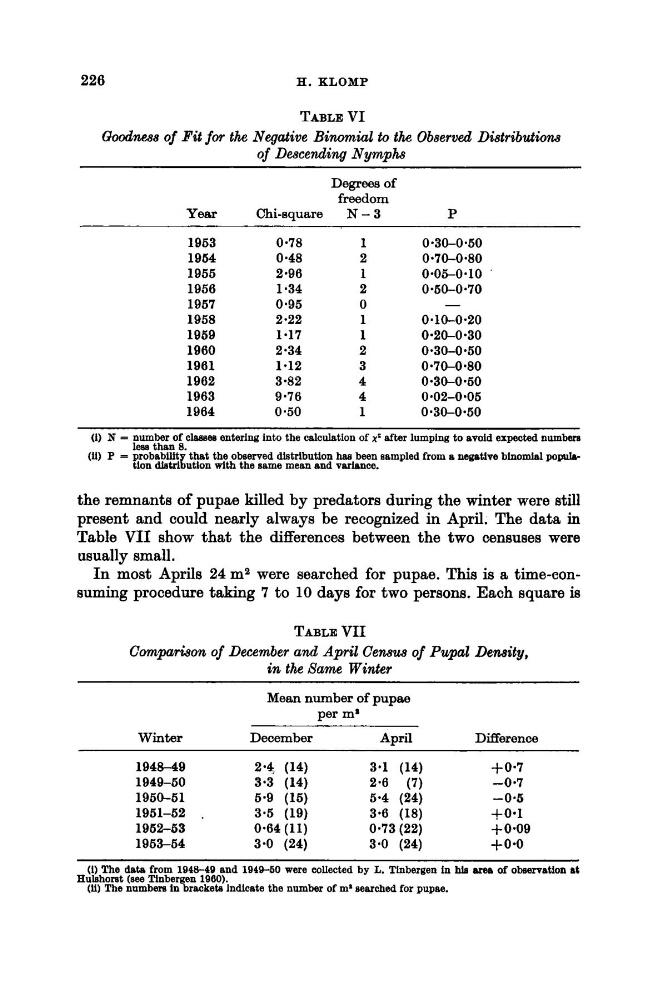
the remnants of pupae killed by predators during the winter were still
present and could nearly always be recognized in April. The data in
Table V I I show that the differences between the two censuses were
usually small.
I n most Aprils 24 ma were searched for pupae. This is a time-eonsuming procedure taking 7 to 10 days for two persons. Each square is
TBLE VII
Cmpar&on of December and April Censua of Pupal Density,
in the # a m Winter
Mean number of pupae
per mr
Winter
December
April
Difference
1948-49
2.4 (14)
3.1 (14)
+O-7
1949-60
3.3 (14)
2.6 (7)
-0.7
1960-61
6.9 (16)
6.4 (24)
-0.6
1961-62 ,
3.6 (19)
3.6 (18)
+0.1
1962-63
0.64 (11)
0.73 (22)
+ 0.09
1963-64
3.0 (24)
3.0 (24)
+o*o
(1) The data from 1048-40 and 1044.50 were collected by L. Tinbergen in hls area of observation at
(ii) The numbers In brackets indicate the number of m' searched for pupae.
Hulshorst (see Tinbergen 1060).
H. KLOYP
TABLE VI
Goodness of Fit for the Negative Binomial to the Obeerved Distributions
of Descending Nymphs
Degrees of
freedom
Year
Chi-square
N - 3
P
1963
1964
1966
1966
1967
1968
1969
1960
1961
1962
1963
1964
0-78
0-48
2.96
1-34
0.96
2.22
1-17
2.34
1.12
3-82
9-76
0.50
1
2
1
2
0
1
1
2
3
4
4
1
0-30-0*60
0*70-0*80
0*06-0~10 '
0-60-0.70
0.10-0.20
0-20-0-30
0-30-0.60
0.70-0.80
0.30-0-60
0.30-0*60
-
0.02-0.06
(1) N = number of claasea entering into the calculation of xE after lumping to avoid expected numbers
(ii) P = probabilit that the observed distribution haa been sampled from a negative binomial pop.&
less than 8.
tion distrliution with the same mean and variance.
the remnants of pupae killed by predators during the winter were still
present and could nearly always be recognized in April. The data in
Table V I I show that the differences between the two censuses were
usually small.
I n most Aprils 24 ma were searched for pupae. This is a time-eonsuming procedure taking 7 to 10 days for two persons. Each square is
TBLE VII
Cmpar&on of December and April Censua of Pupal Density,
in the # a m Winter
Mean number of pupae
per mr
Winter
December
April
Difference
1948-49
2.4 (14)
3.1 (14)
+O-7
1949-60
3.3 (14)
2.6 (7)
-0.7
1960-61
6.9 (16)
6.4 (24)
-0.6
1961-62 ,
3.6 (19)
3.6 (18)
+0.1
1962-63
0.64 (11)
0.73 (22)
+ 0.09
1963-64
3.0 (24)
3.0 (24)
+o*o
(1) The data from 1048-40 and 1044.50 were collected by L. Tinbergen in hls area of observation at
(ii) The numbers In brackets indicate the number of m' searched for pupae.
Hulshorst (see Tinbergen 1060).