

90
MANFRED D . ENQELMANN
widely assumed in energetic studies, but .Phillipson contended that there
is differential absorption especially by the immaturc stages of the animals. Employing field data and biomass estimates from other studies,
Phillipson estimated that the phalangids free from 1-34 to 1-47 kcal/ma
of ground layer in an English deciduous woods in a year. The daily
respiration rates of the phalangids agreed closely with those of the
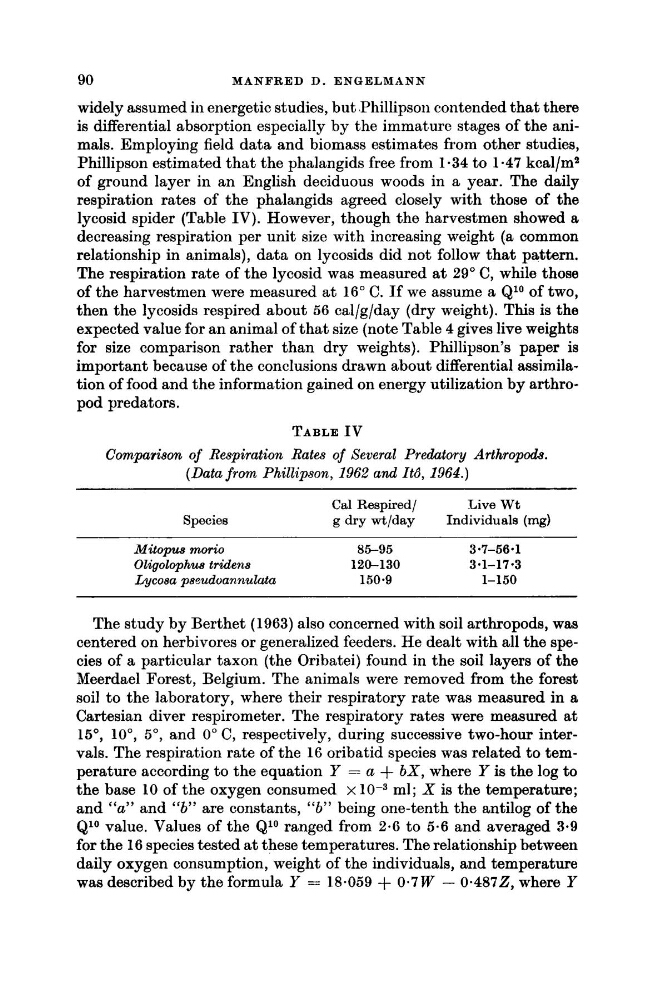
lycosid spider (Table IV). However, though the harvestmen showed a
decreasing respiration per unit size with increasing weight (a common
relationship in animals), data on lycosids did not follow that pattern.
The respiration rate of the lycosid was measured a t 29” C, while those
of the harvestmen were measured at 16” C. If we assume a &Io of two,
then the lycosids respired about 56 cal/g/day (dry weight). This is the
expected value for an animal of that size (note Table 4 gives live weights
for size comparison rather than dry weights). Phillipson’s paper is
important because of the conclusions drawn about differential assimilation of food and the information gained on energy utilization by arthropod predators.
TABLE IV
Comparison of Respiration Rates of Xeveral Predatory Arthropods.
(Data from Phillipson, 1962 and ItB, 1964.)
Cal Respired/
Live Wt
Specie 8
g dry wt/day
Individuals (mg)
Mitopus morio
85-95
3.7-56.1
Oligolophue tridena
120-130
3 -1-17 ‘3
Lycosa pseudoannulata
150.9
1-150
The study by Berthet (1963) also concerned with soil arthropods, was
centered on herbivores or generalized feeders. He dealt with all the species of a particular taxon (the Oribatei) found in the soil layers of the
Meerdael Forest, Belgium. The animals were removed from the forest
soil to the laboratory, where their respiratory rate was measured in a
Cartesian diver respirometer. The respiratory rates were measured at
1 5 O , lo”, 5”, and 0” C, respectively, during successive two-hour intervals. The respiration rate of the 16 oribatid species was related to temperature according to the equation Y = a + b X , where Y is the log to
the base 10 of the oxygen consumed x
ml; X is the temperature;
and “a” and “b” are constants, “b” being one-tenth the antilog of the
&Io value. Values of the &Io ranged from 2.6 to 5.6 and averaged 3-9
for the 16 species tested at these temperatures. The relationship between
daily oxygen consumption, weight of the individuals, and temperature
was described by the formula Y = 18.059 + 0.7W - 0.4872, where Y
MANFRED D . ENQELMANN
widely assumed in energetic studies, but .Phillipson contended that there
is differential absorption especially by the immaturc stages of the animals. Employing field data and biomass estimates from other studies,
Phillipson estimated that the phalangids free from 1-34 to 1-47 kcal/ma
of ground layer in an English deciduous woods in a year. The daily
respiration rates of the phalangids agreed closely with those of the
lycosid spider (Table IV). However, though the harvestmen showed a
decreasing respiration per unit size with increasing weight (a common
relationship in animals), data on lycosids did not follow that pattern.
The respiration rate of the lycosid was measured a t 29” C, while those
of the harvestmen were measured at 16” C. If we assume a &Io of two,
then the lycosids respired about 56 cal/g/day (dry weight). This is the
expected value for an animal of that size (note Table 4 gives live weights
for size comparison rather than dry weights). Phillipson’s paper is
important because of the conclusions drawn about differential assimilation of food and the information gained on energy utilization by arthropod predators.
TABLE IV
Comparison of Respiration Rates of Xeveral Predatory Arthropods.
(Data from Phillipson, 1962 and ItB, 1964.)
Cal Respired/
Live Wt
Specie 8
g dry wt/day
Individuals (mg)
Mitopus morio
85-95
3.7-56.1
Oligolophue tridena
120-130
3 -1-17 ‘3
Lycosa pseudoannulata
150.9
1-150
The study by Berthet (1963) also concerned with soil arthropods, was
centered on herbivores or generalized feeders. He dealt with all the species of a particular taxon (the Oribatei) found in the soil layers of the
Meerdael Forest, Belgium. The animals were removed from the forest
soil to the laboratory, where their respiratory rate was measured in a
Cartesian diver respirometer. The respiratory rates were measured at
1 5 O , lo”, 5”, and 0” C, respectively, during successive two-hour intervals. The respiration rate of the 16 oribatid species was related to temperature according to the equation Y = a + b X , where Y is the log to
the base 10 of the oxygen consumed x
ml; X is the temperature;
and “a” and “b” are constants, “b” being one-tenth the antilog of the
&Io value. Values of the &Io ranged from 2.6 to 5.6 and averaged 3-9
for the 16 species tested at these temperatures. The relationship between
daily oxygen consumption, weight of the individuals, and temperature
was described by the formula Y = 18.059 + 0.7W - 0.4872, where Y