

ANALYSIS O F PROCESSES I N CONTROL O F INSECTS
23
4
3
5
- E 2
1
0
‘*Fa First equilibrium
\*--level-First equilibrium
____--\*--level-level
0
1
1
1
1
1
1
1
1
1
1
1
1
1
1 2 3 4 5 6 7 8 9 1 0 II 12 1 3
1
1
1
1
1
1
1
1
1
1
1
1
1
1 2 3 4 5 6 7 8 9 1 0 II 12 1 3
Time, or generations
(6)
1
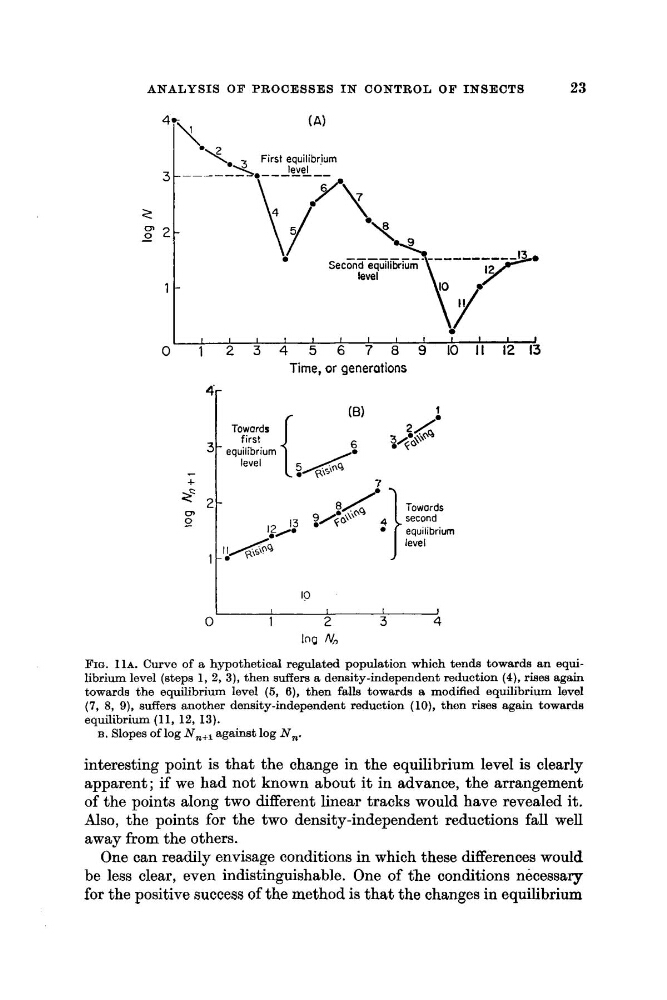
FIG. l l ~ .
Curve of a hypothetical regulated population which tends towards an equilibrium level (steps 1, 2, 3), then suffers a density-independent reduction (4), rises again
towards the equilibrium level (6, 6), then falls towards a modified equilibrium level
(7, 8, 9), suffers another density-independent reduction (lo), then rises again towards
equilibrium (11, 12, 13).
B. Slopes of log N,,, against log N,.
interesting point is that the change in the equilibrium level is clearly
apparent; if we had not known about it in advance, the arrangement
of the points along two different linear tracks would have revealed it.
Also, the points for the two density-independent reductions fall well
away from the others.
One can readily envisage conditions in which these differences would
be less clear, even indistinguishable. One of the conditions necessary
for the positive success of the method is that the changes in equilibrium
23
4
3
5
- E 2
1
0
‘*Fa First equilibrium
\*--level-First equilibrium
____--\*--level-level
0
1
1
1
1
1
1
1
1
1
1
1
1
1
1 2 3 4 5 6 7 8 9 1 0 II 12 1 3
1
1
1
1
1
1
1
1
1
1
1
1
1
1 2 3 4 5 6 7 8 9 1 0 II 12 1 3
Time, or generations
(6)
1
FIG. l l ~ .
Curve of a hypothetical regulated population which tends towards an equilibrium level (steps 1, 2, 3), then suffers a density-independent reduction (4), rises again
towards the equilibrium level (6, 6), then falls towards a modified equilibrium level
(7, 8, 9), suffers another density-independent reduction (lo), then rises again towards
equilibrium (11, 12, 13).
B. Slopes of log N,,, against log N,.
interesting point is that the change in the equilibrium level is clearly
apparent; if we had not known about it in advance, the arrangement
of the points along two different linear tracks would have revealed it.
Also, the points for the two density-independent reductions fall well
away from the others.
One can readily envisage conditions in which these differences would
be less clear, even indistinguishable. One of the conditions necessary
for the positive success of the method is that the changes in equilibrium