

130
J. ROGER BRAY AND EVILLE GOREAM
TABLE XI11
Litter Production and Exposure in German Forests*
Exposure
Total litter production, metric tonslhalyr
Total no.
Fagus
Picea
Pinus
Mean
Mean
silvatica
abies
silvestris
weighted
by no. of
stands
stands
NE
4.1
4.7
4.0
4.3
4.3
14.5
SE
4.4
3.7
3.7
3.9
3.8
10.0
SW
3.9
2.5
3.8
3.4
3.2
15.0
Nw
4.1
3.6
3.6
3.8
3.7
23.5
* From data in Ebermayer f1876).
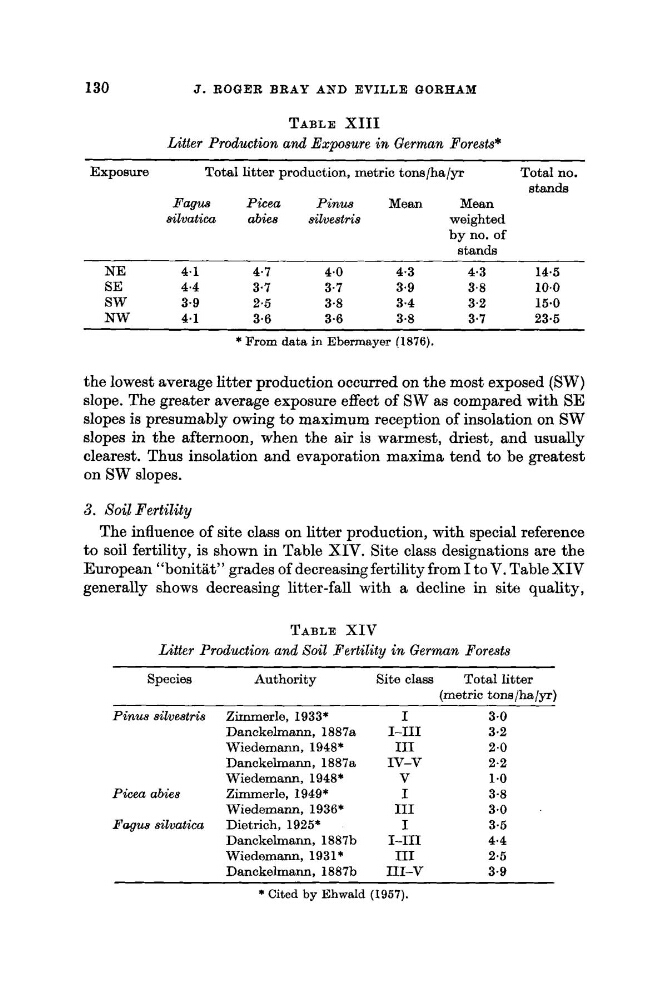
the lowest average litter production occurred on the most exposed (SW)
slope. The greater average exposure effect of SW as compared with SE
slopes is presumably owing to maximum reception of insolation on SW
slopes in the afternoon, when the air is warmest, driest, and usually
clearest. Thus insolation and evaporation maxima tend to be greatest
on SW slopes.
3. Soil Fertility
The influence of site class on litter production, with special reference
to soil fertility, is shown in Table XIV. Site class designations are the
European “bonitat” grades of decreasing fertility from I to V. Table XIV
generally shows decreasing litter-fall with a decline in site quality,
TABLE XIV
Litter Production and Soil Fertility in German Forests
Species
Authority
Site class
Total litter
(metric tonslhalyr)
Pinus szhestris Zimmerle, 1933*
I
3.0
Danckelmann, 1887a
1-111
3.2
Wiedemann, 1948*
I11
2.0
Danckelmann, 1887a
m-v
2.2
Wiedemann, 1948*
V
1.0
Piceu abies
Zimmerle, 1949*
I
3-8
Wiedemann, 1936*
I11
3.0
.
Fagus silvatica
Dietrich, 1925*
I
3.5
Danckelmann, 1887b
1-111
4.4
Wiedemann, 1931*
I11
2.5
Danckelmann, 188713
111-V
3-9
~~
~~
* Cited by EhwaId (1957).
J. ROGER BRAY AND EVILLE GOREAM
TABLE XI11
Litter Production and Exposure in German Forests*
Exposure
Total litter production, metric tonslhalyr
Total no.
Fagus
Picea
Pinus
Mean
Mean
silvatica
abies
silvestris
weighted
by no. of
stands
stands
NE
4.1
4.7
4.0
4.3
4.3
14.5
SE
4.4
3.7
3.7
3.9
3.8
10.0
SW
3.9
2.5
3.8
3.4
3.2
15.0
Nw
4.1
3.6
3.6
3.8
3.7
23.5
* From data in Ebermayer f1876).
the lowest average litter production occurred on the most exposed (SW)
slope. The greater average exposure effect of SW as compared with SE
slopes is presumably owing to maximum reception of insolation on SW
slopes in the afternoon, when the air is warmest, driest, and usually
clearest. Thus insolation and evaporation maxima tend to be greatest
on SW slopes.
3. Soil Fertility
The influence of site class on litter production, with special reference
to soil fertility, is shown in Table XIV. Site class designations are the
European “bonitat” grades of decreasing fertility from I to V. Table XIV
generally shows decreasing litter-fall with a decline in site quality,
TABLE XIV
Litter Production and Soil Fertility in German Forests
Species
Authority
Site class
Total litter
(metric tonslhalyr)
Pinus szhestris Zimmerle, 1933*
I
3.0
Danckelmann, 1887a
1-111
3.2
Wiedemann, 1948*
I11
2.0
Danckelmann, 1887a
m-v
2.2
Wiedemann, 1948*
V
1.0
Piceu abies
Zimmerle, 1949*
I
3-8
Wiedemann, 1936*
I11
3.0
.
Fagus silvatica
Dietrich, 1925*
I
3.5
Danckelmann, 1887b
1-111
4.4
Wiedemann, 1931*
I11
2.5
Danckelmann, 188713
111-V
3-9
~~
~~
* Cited by EhwaId (1957).