

9. SACCHARIDES: ALTERNATE ROUTES OF METABOLISM
461
TABLE VI
ESTIMATION OF CATABOLIC PATHWAYS OF GLUCOSE
Microorganism
Acetobacter suboxydans
Zymomonas mobilis
Pseudomonas saccharophila
Pseudomonas reptilivora
Pseudomonas aeruginosa
Sarcina lutea
Streptomyces griseus
Penicillium chrysogenum
Penicillium
digitatum
Fusarium lini
Escherichia coli
Saccharomyces cerevisiae
Candida utilis
Bacillus subtilis
Pathway estimation
0
EMP
(%)
■ —
70
97
77
83
77
83
72
88
83-100
6
66- 81
74
59
HMP
(%)
100
28
29
30
3
23
17
23
17
28
12
0-27
6
19-34
26
41
ED
(%)
—
100
100
72
71
—
—
—
—
—
—
—
—
—
Method
Radiorespirometry
Radiorespirometry,
Eq. 6
Radiorespirometry,
Eq. 6
Radiorespirometry,
Eq. 6
Radiorespirometry,
Eq. 6
Radiochemical yield
of intermediate
Radiorespirometry,
Eq. 3
Radiorespirometry,
Eq. 3
Radiorespirometry:
Eq. 3
Eq. 2
Sp. Act, of C
14 0 2
Radiorespirometry,
Eq. 3
Radiorespirometry,
Eq. 3
Sp. Act. of intermediates
Sp. Act. of intermediates
Radiorespirometry:
Eq. 3
Eq. 7
C
Reference
m
142
142
142
142
135
15
15
15
146
147
15
15
132
132
145
0 EMP = Embden-Meyerhof-Parnas pathway (glycolysis); HMP = hexose monophosphate pathway (phosphogluconate cleavage); ED = Entner-Doudoroff pathway.
b Experimental conditions varied from depleted resting cells to growing cells.
c Equation 7 is used under the assumption that G'T = 0.
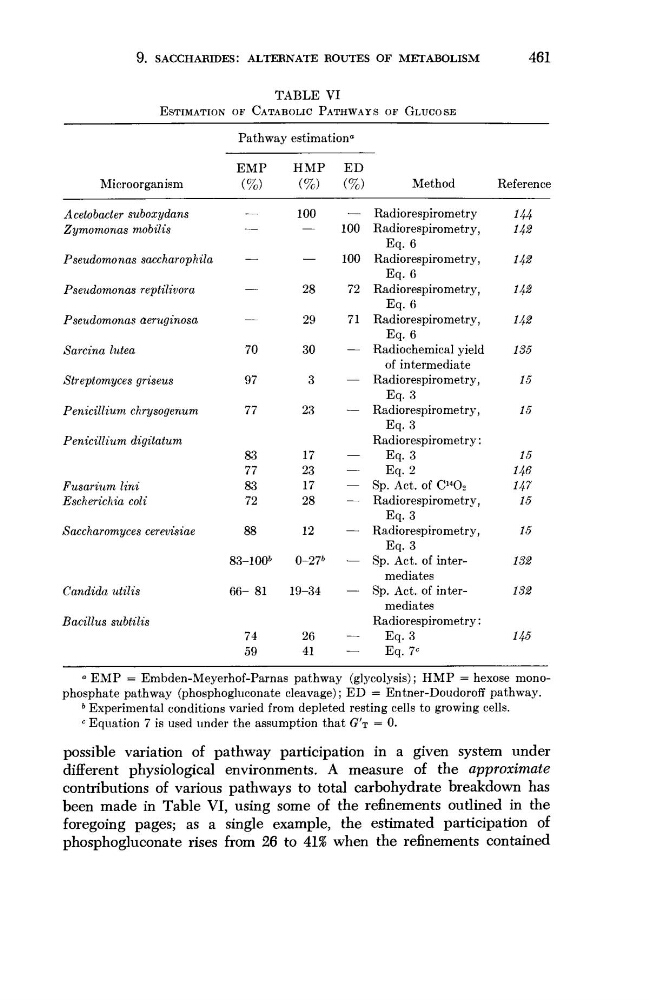
possible variation of pathway participation in a given system under
different physiological environments. A measure of the approximate
contributions of various pathways to total carbohydrate breakdown has
been made in Table VI, using some of the refinements outlined in the
foregoing pages; as a single example, the estimated participation of
phosphogluconate rises from 26 to 41% when the refinements contained
461
TABLE VI
ESTIMATION OF CATABOLIC PATHWAYS OF GLUCOSE
Microorganism
Acetobacter suboxydans
Zymomonas mobilis
Pseudomonas saccharophila
Pseudomonas reptilivora
Pseudomonas aeruginosa
Sarcina lutea
Streptomyces griseus
Penicillium chrysogenum
Penicillium
digitatum
Fusarium lini
Escherichia coli
Saccharomyces cerevisiae
Candida utilis
Bacillus subtilis
Pathway estimation
0
EMP
(%)
■ —
70
97
77
83
77
83
72
88
83-100
6
66- 81
74
59
HMP
(%)
100
28
29
30
3
23
17
23
17
28
12
0-27
6
19-34
26
41
ED
(%)
—
100
100
72
71
—
—
—
—
—
—
—
—
—
Method
Radiorespirometry
Radiorespirometry,
Eq. 6
Radiorespirometry,
Eq. 6
Radiorespirometry,
Eq. 6
Radiorespirometry,
Eq. 6
Radiochemical yield
of intermediate
Radiorespirometry,
Eq. 3
Radiorespirometry,
Eq. 3
Radiorespirometry:
Eq. 3
Eq. 2
Sp. Act, of C
14 0 2
Radiorespirometry,
Eq. 3
Radiorespirometry,
Eq. 3
Sp. Act. of intermediates
Sp. Act. of intermediates
Radiorespirometry:
Eq. 3
Eq. 7
C
Reference
m
142
142
142
142
135
15
15
15
146
147
15
15
132
132
145
0 EMP = Embden-Meyerhof-Parnas pathway (glycolysis); HMP = hexose monophosphate pathway (phosphogluconate cleavage); ED = Entner-Doudoroff pathway.
b Experimental conditions varied from depleted resting cells to growing cells.
c Equation 7 is used under the assumption that G'T = 0.
possible variation of pathway participation in a given system under
different physiological environments. A measure of the approximate
contributions of various pathways to total carbohydrate breakdown has
been made in Table VI, using some of the refinements outlined in the
foregoing pages; as a single example, the estimated participation of
phosphogluconate rises from 26 to 41% when the refinements contained