

5. DISTRIBUTION OF PHOSPHOLIPIDS
253
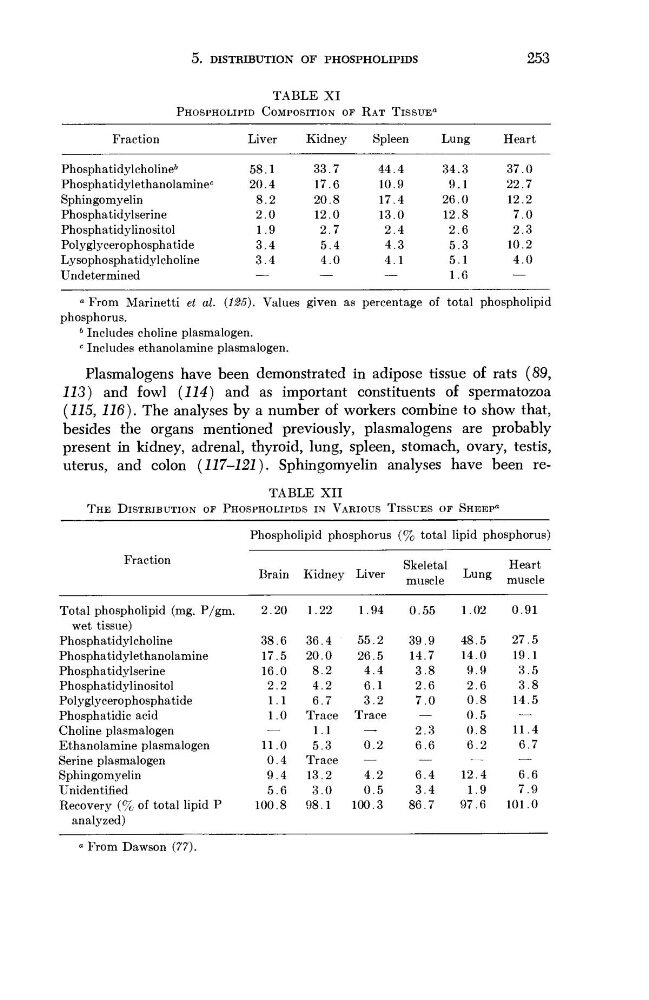
TABLE XI
PHOSPHOLIPID COMPOSITION OF RAT TISSUE"
Fraction
Phosphatidylcholine
6
Phosphatidylethanolamine
c
Sphingomyelin
Phosphatidylserine
Phosphatidylinositol
Polyglycerophosphatide
Lysophosphatidylcholine
Undetermined
Liver
58.1
20.4
8.2
2.0
1.9
3.4
3.4
—
Kidney
33.7
17.6
20.8
12.0
2.7
5.4
4.0
—
Spleen
44.4
10.9
17.4
13.0
2.4
4.3
4.1
—
Lung
34.3
9.1
26.0
12.8
2.6
5.3
5.1
1.6
Heart
37.0
22.7
12.2
7.0
2.3
10.2
4.0
—
a From Marinetti et al. {125). Values given as percentage of total phospholipid
phosphorus.
6 Includes choline plasmalogen.
c Includes ethanolamine plasmalogen.
Plasmalogens have been demonstrated in adipose tissue of rats (89,
113) and fowl (114) and as important constituents of spermatozoa
(115, 116). The analyses by a number of workers combine to show that,
besides the organs mentioned previously, plasmalogens are probably
present in kidney, adrenal, thyroid, lung, spleen, stomach, ovary, testis,
uterus, and colon (117-121). Sphingomyelin analyses have been reTABLE XII
THE DISTRIBUTION OF PHOSPHOLIPIDS IN VARIOUS TISSUES OF SHEEP
0
Phospholipid phosphorus (% total lipid phosphorus)
Fraction
Total phospholipid (mg. P/gm.
wet tissue)
Phosphatidylcholine
Phosphatidylethanolamine
Phosphatidylserine
Phosphatidylinositol
Polyglycerophosphatide
Phosphatidic acid
Choline plasmalogen
Ethanolamine plasmalogen
Serine plasmalogen
Sphingomyelin
Unidentified
Recovery (% of total lipid P
Brain
2.20
38.6
17.5
16.0
2.2
1.1
1.0
—
11.0
0.4
9.4
5.6
100.8
Kidney
1.22
36.4
20.0
8.2
4.2
6.7
Trace
1.1
5.3
Trace
13.2
3.0
98.1
Liver
1.94
55.2
26.5
4.4
6.1
3.2
Trace
—
0.2
—
4.2
0.5
100.3
Skeletal
muscle
0.55
39.9
14.7
3.8
2.6
7.0
—
2.3
6.6
—
6.4
3.4
86.7
Lung
1.02
48.5
14.0
9.9
2.6
0.8
0.5
0.8
6.2
—
12.4
1.9
97.6
Heart
muscle
0.91
27.5
19.1
3.5
3.8
14.5
—
11.4
6.7
—
6.6
7.9
101.0
analyzed)
a From Dawson {77).
253
TABLE XI
PHOSPHOLIPID COMPOSITION OF RAT TISSUE"
Fraction
Phosphatidylcholine
6
Phosphatidylethanolamine
c
Sphingomyelin
Phosphatidylserine
Phosphatidylinositol
Polyglycerophosphatide
Lysophosphatidylcholine
Undetermined
Liver
58.1
20.4
8.2
2.0
1.9
3.4
3.4
—
Kidney
33.7
17.6
20.8
12.0
2.7
5.4
4.0
—
Spleen
44.4
10.9
17.4
13.0
2.4
4.3
4.1
—
Lung
34.3
9.1
26.0
12.8
2.6
5.3
5.1
1.6
Heart
37.0
22.7
12.2
7.0
2.3
10.2
4.0
—
a From Marinetti et al. {125). Values given as percentage of total phospholipid
phosphorus.
6 Includes choline plasmalogen.
c Includes ethanolamine plasmalogen.
Plasmalogens have been demonstrated in adipose tissue of rats (89,
113) and fowl (114) and as important constituents of spermatozoa
(115, 116). The analyses by a number of workers combine to show that,
besides the organs mentioned previously, plasmalogens are probably
present in kidney, adrenal, thyroid, lung, spleen, stomach, ovary, testis,
uterus, and colon (117-121). Sphingomyelin analyses have been reTABLE XII
THE DISTRIBUTION OF PHOSPHOLIPIDS IN VARIOUS TISSUES OF SHEEP
0
Phospholipid phosphorus (% total lipid phosphorus)
Fraction
Total phospholipid (mg. P/gm.
wet tissue)
Phosphatidylcholine
Phosphatidylethanolamine
Phosphatidylserine
Phosphatidylinositol
Polyglycerophosphatide
Phosphatidic acid
Choline plasmalogen
Ethanolamine plasmalogen
Serine plasmalogen
Sphingomyelin
Unidentified
Recovery (% of total lipid P
Brain
2.20
38.6
17.5
16.0
2.2
1.1
1.0
—
11.0
0.4
9.4
5.6
100.8
Kidney
1.22
36.4
20.0
8.2
4.2
6.7
Trace
1.1
5.3
Trace
13.2
3.0
98.1
Liver
1.94
55.2
26.5
4.4
6.1
3.2
Trace
—
0.2
—
4.2
0.5
100.3
Skeletal
muscle
0.55
39.9
14.7
3.8
2.6
7.0
—
2.3
6.6
—
6.4
3.4
86.7
Lung
1.02
48.5
14.0
9.9
2.6
0.8
0.5
0.8
6.2
—
12.4
1.9
97.6
Heart
muscle
0.91
27.5
19.1
3.5
3.8
14.5
—
11.4
6.7
—
6.6
7.9
101.0
analyzed)
a From Dawson {77).