

11. ORGANISMS AND THERMAL ENERGY
495
TABLE II
ENERGY PRODUCTION BY SOME REPRESENTATIVE HOMOIOTHERMS AND POIKILOTHERMS^
1
Animal
HOMOIOTHERMS
Man
Baboon
Chimpanzee
Macaque
Rhesus monkey
Beef cattle
Sheep
Swine
Shetland pony
Dog
Cat
Rabbit
Rat
Mouse
Guinea pig
Marmot
Elephant
Chicken
Ring dove
Duck
Goose
Parakeet
Pigeon
Canary
POIKILOTHERMS
Lizard
Turtle
Frog
Toad
Sturgeon
Body weight
(kg.)
56-65
6.2
38
4.2
3.2
400-500
42.7-49.5
250
280
11.7-15.5
3.0
3.5
0.2
0.02
0.8
2.6
3670
2.3
0.15
0.93
3.3-5.0
0.03
0.28
0.016
1.2
0.14
0.05
0.05
1400
Body surface
area
(square meters)
1.65-1.83
0.40
1.1
0.31
0.26
3.2-4.7
0.95-1.1
3.2
4.4
0.58-0.65
0.2
0.2
0.03
0.005
0.07
0.18
23.8
0.19
0.03
0.1
0.23-0.29
0.009
0.04
0.006
0.11
0.02
—
—
11.8
Energy
(cal./kg./day)
23.2-25.5
48
29.2
49.3
48.4
15.2
25.7-26.3
15.8
16.7
33.5-38.5
50
47
130
170
62
28.3
13.3
78
130
90
54-61
225
100
310
2.5
11.4
—
—
0.3
output
0
(cal./square
meter/day)
790^-910
760
980
675
610
1635
1160-1180
1230
1060
770-800
750
810
830
525
690
420
2060
940
700
855
880-940
690
670
760
29
64
130
130
31
a Data from W. S. Spector, ed., "Handbook of Biological Data." National Academy of Sciences—National Research Council, Washington, D. C, 1956.
δ The energy output values represent basal metabolism.
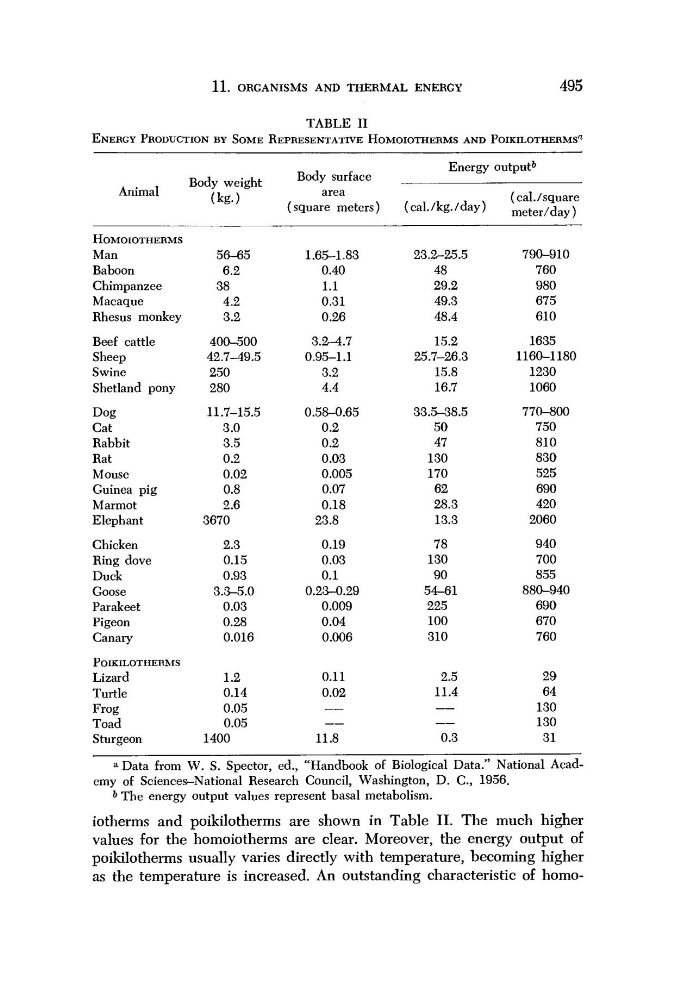
iotherms and poikilotherms are shown in Table II. The much higher
values for the homoiotherms are clear. Moreover, the energy output of
poikilotherms usually varies directly with temperature, becoming higher
as the temperature is increased. An outstanding characteristic of homo-
495
TABLE II
ENERGY PRODUCTION BY SOME REPRESENTATIVE HOMOIOTHERMS AND POIKILOTHERMS^
1
Animal
HOMOIOTHERMS
Man
Baboon
Chimpanzee
Macaque
Rhesus monkey
Beef cattle
Sheep
Swine
Shetland pony
Dog
Cat
Rabbit
Rat
Mouse
Guinea pig
Marmot
Elephant
Chicken
Ring dove
Duck
Goose
Parakeet
Pigeon
Canary
POIKILOTHERMS
Lizard
Turtle
Frog
Toad
Sturgeon
Body weight
(kg.)
56-65
6.2
38
4.2
3.2
400-500
42.7-49.5
250
280
11.7-15.5
3.0
3.5
0.2
0.02
0.8
2.6
3670
2.3
0.15
0.93
3.3-5.0
0.03
0.28
0.016
1.2
0.14
0.05
0.05
1400
Body surface
area
(square meters)
1.65-1.83
0.40
1.1
0.31
0.26
3.2-4.7
0.95-1.1
3.2
4.4
0.58-0.65
0.2
0.2
0.03
0.005
0.07
0.18
23.8
0.19
0.03
0.1
0.23-0.29
0.009
0.04
0.006
0.11
0.02
—
—
11.8
Energy
(cal./kg./day)
23.2-25.5
48
29.2
49.3
48.4
15.2
25.7-26.3
15.8
16.7
33.5-38.5
50
47
130
170
62
28.3
13.3
78
130
90
54-61
225
100
310
2.5
11.4
—
—
0.3
output
0
(cal./square
meter/day)
790^-910
760
980
675
610
1635
1160-1180
1230
1060
770-800
750
810
830
525
690
420
2060
940
700
855
880-940
690
670
760
29
64
130
130
31
a Data from W. S. Spector, ed., "Handbook of Biological Data." National Academy of Sciences—National Research Council, Washington, D. C, 1956.
δ The energy output values represent basal metabolism.
iotherms and poikilotherms are shown in Table II. The much higher
values for the homoiotherms are clear. Moreover, the energy output of
poikilotherms usually varies directly with temperature, becoming higher
as the temperature is increased. An outstanding characteristic of homo-