

132
HERMAN
DENIS
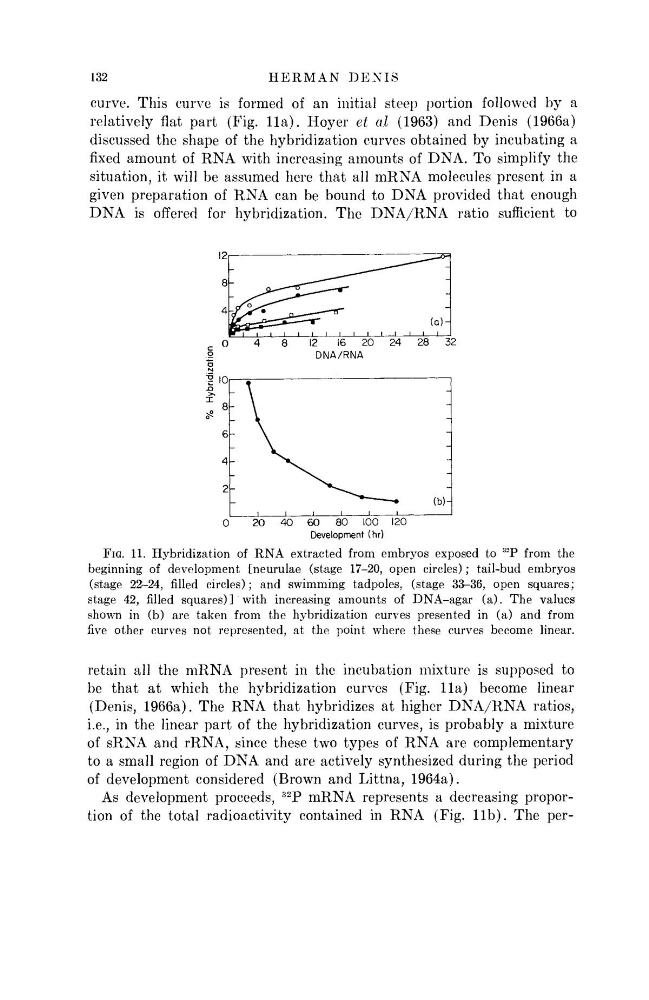
curve. This curve is formed of an initial steep portion followed by a
relatively flat part (Fig. 11a). Hoyer et al (1963) and Denis (1966a)
discussed the shape of the hybridization curves obtained by incubating a
fixed amount of RNA with increasing amounts of DNA. To simplify the
situation, it will be assumed here that all mRNA molecules present in a
given preparation of RNA can be bound to DNA provided that enough
DNA is offered for hybridization. The DNA/RNA ratio sufficient to
)
4
8
12
16
20
24
28
32
DNA/RNA
I
i
i
i
i
1
1
—
0
20
40
60
80
100 120
Development (hr)
FIG. 11. Hybridization of RNA extracted from embryos exposed to
3 2
P from the
beginning of development [neurulae (stage 17-20, open circles); tail-bud embryos
(stage 22-24, filled circles); and swimming tadpoles, (stage 33-36, open squares;
stage 42, filled squares) ] with increasing amounts of DNA-agar (a). The values
shown in (b) are taken from the hybridization curves presented in (a) and from
five other curves not represented, at the point where these curves become linear.
retain all the mRNA present in the incubation mixture is supposed to
be that at which the hybridization curves (Fig. 11a) become linear
(Denis, 1966a). The RNA that hybridizes at higher DNA/RNA ratios,
i.e., in the linear part of the hybridization curves, is probably a mixture
of sRNA and rRNA, since these two types of RNA are complementary
to a small region of DNA and are actively synthesized during the period
of development considered (Brown and Littna, 1964a).
As development proceeds,
3 2
P mRNA represents a decreasing proportion of the total radioactivity contained in RNA (Fig. lib). The per% Hybridization
HERMAN
DENIS
curve. This curve is formed of an initial steep portion followed by a
relatively flat part (Fig. 11a). Hoyer et al (1963) and Denis (1966a)
discussed the shape of the hybridization curves obtained by incubating a
fixed amount of RNA with increasing amounts of DNA. To simplify the
situation, it will be assumed here that all mRNA molecules present in a
given preparation of RNA can be bound to DNA provided that enough
DNA is offered for hybridization. The DNA/RNA ratio sufficient to
)
4
8
12
16
20
24
28
32
DNA/RNA
I
i
i
i
i
1
1
—
0
20
40
60
80
100 120
Development (hr)
FIG. 11. Hybridization of RNA extracted from embryos exposed to
3 2
P from the
beginning of development [neurulae (stage 17-20, open circles); tail-bud embryos
(stage 22-24, filled circles); and swimming tadpoles, (stage 33-36, open squares;
stage 42, filled squares) ] with increasing amounts of DNA-agar (a). The values
shown in (b) are taken from the hybridization curves presented in (a) and from
five other curves not represented, at the point where these curves become linear.
retain all the mRNA present in the incubation mixture is supposed to
be that at which the hybridization curves (Fig. 11a) become linear
(Denis, 1966a). The RNA that hybridizes at higher DNA/RNA ratios,
i.e., in the linear part of the hybridization curves, is probably a mixture
of sRNA and rRNA, since these two types of RNA are complementary
to a small region of DNA and are actively synthesized during the period
of development considered (Brown and Littna, 1964a).
As development proceeds,
3 2
P mRNA represents a decreasing proportion of the total radioactivity contained in RNA (Fig. lib). The per% Hybridization