

118
BRIAN POOLE
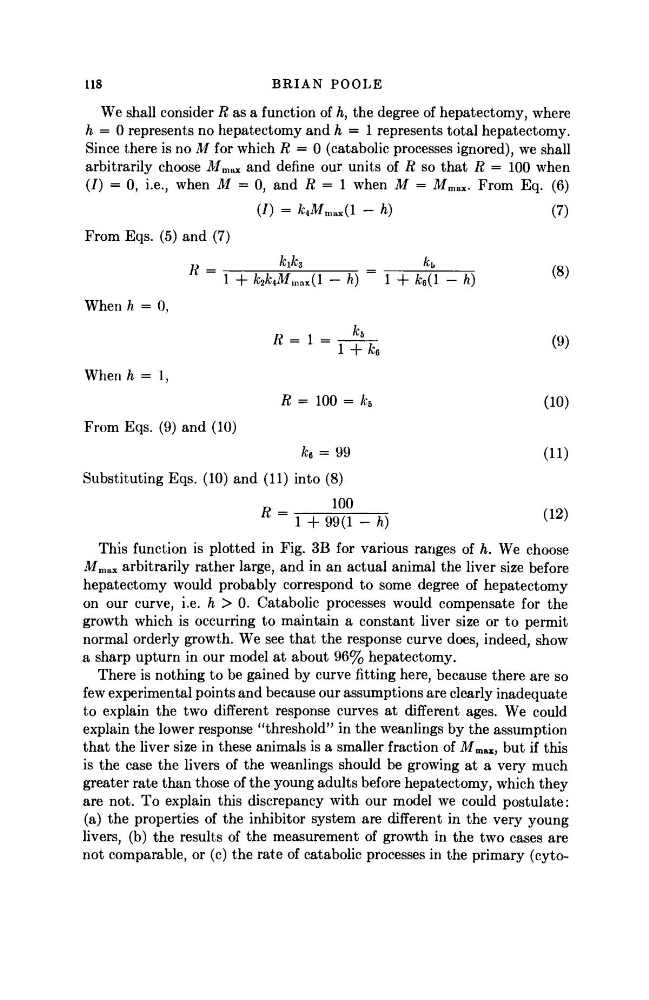
We shall consider R as a function of A, the degree of hepatectomy, where
h = 0 represents no hepatectomy and h = 1 represents total hepatectomy.
Since there is no M for which R = 0 (catabolic processes ignored), we shall
arbitrarily choose M max and define our units of R so that R = 100 when
(J) = 0, i.e., when M = 0, and R = 1 when M = M max . From Eq. (6)
(/) = Mf m a x
(l - h)
(7)
From Eqs. (5) and (7)
1 + fcMf„„(1 - Ä)
1 + fce(l - A)
W
R = 100 = A-5
(10)
When Ä = 0,
When h = 1,
From Eqs. (9) and (10)
h = 99
(11)
Substituting Eqs. (10) and (11) into (8)
100
1 + 99(1 - A)
( 1 2
}
This function is plotted in Fig. 3B for various ranges of h. We choose
M m a x arbitrarily rather large, and in an actual animal the liver size before
hepatectomy would probably correspond to some degree of hepatectomy
on our curve, i.e. h > 0. Catabolic processes would compensate for the
growth which is occurring to maintain a constant liver size or to permit
normal orderly growth. We see that the response curve does, indeed, show
a sharp upturn in our model at about 96% hepatectomy.
There is nothing to be gained by curve fitting here, because there are so
few experimental points and because our assumptions are clearly inadequate
to explain the two different response curves at different ages. We could
explain the lower response "threshold" in the weanlings by the assumption
that the liver size in these animals is a smaller fraction of M m a x
, but if this
is the case the livers of the weanlings should be growing at a very much
greater rate than those of the young adults before hepatectomy, which they
are not. To explain this discrepancy with our model we could postulate:
(a) the properties of the inhibitor system are different in the very young
livers, (b) the results of the measurement of growth in the two cases are
not comparable, or (c) the rate of catabolic processes in the primary (cyto-
BRIAN POOLE
We shall consider R as a function of A, the degree of hepatectomy, where
h = 0 represents no hepatectomy and h = 1 represents total hepatectomy.
Since there is no M for which R = 0 (catabolic processes ignored), we shall
arbitrarily choose M max and define our units of R so that R = 100 when
(J) = 0, i.e., when M = 0, and R = 1 when M = M max . From Eq. (6)
(/) = Mf m a x
(l - h)
(7)
From Eqs. (5) and (7)
1 + fcMf„„(1 - Ä)
1 + fce(l - A)
W
R = 100 = A-5
(10)
When Ä = 0,
When h = 1,
From Eqs. (9) and (10)
h = 99
(11)
Substituting Eqs. (10) and (11) into (8)
100
1 + 99(1 - A)
( 1 2
}
This function is plotted in Fig. 3B for various ranges of h. We choose
M m a x arbitrarily rather large, and in an actual animal the liver size before
hepatectomy would probably correspond to some degree of hepatectomy
on our curve, i.e. h > 0. Catabolic processes would compensate for the
growth which is occurring to maintain a constant liver size or to permit
normal orderly growth. We see that the response curve does, indeed, show
a sharp upturn in our model at about 96% hepatectomy.
There is nothing to be gained by curve fitting here, because there are so
few experimental points and because our assumptions are clearly inadequate
to explain the two different response curves at different ages. We could
explain the lower response "threshold" in the weanlings by the assumption
that the liver size in these animals is a smaller fraction of M m a x
, but if this
is the case the livers of the weanlings should be growing at a very much
greater rate than those of the young adults before hepatectomy, which they
are not. To explain this discrepancy with our model we could postulate:
(a) the properties of the inhibitor system are different in the very young
livers, (b) the results of the measurement of growth in the two cases are
not comparable, or (c) the rate of catabolic processes in the primary (cyto-