

3.2. The Capital Budgeting Problem {Problem
II)
81
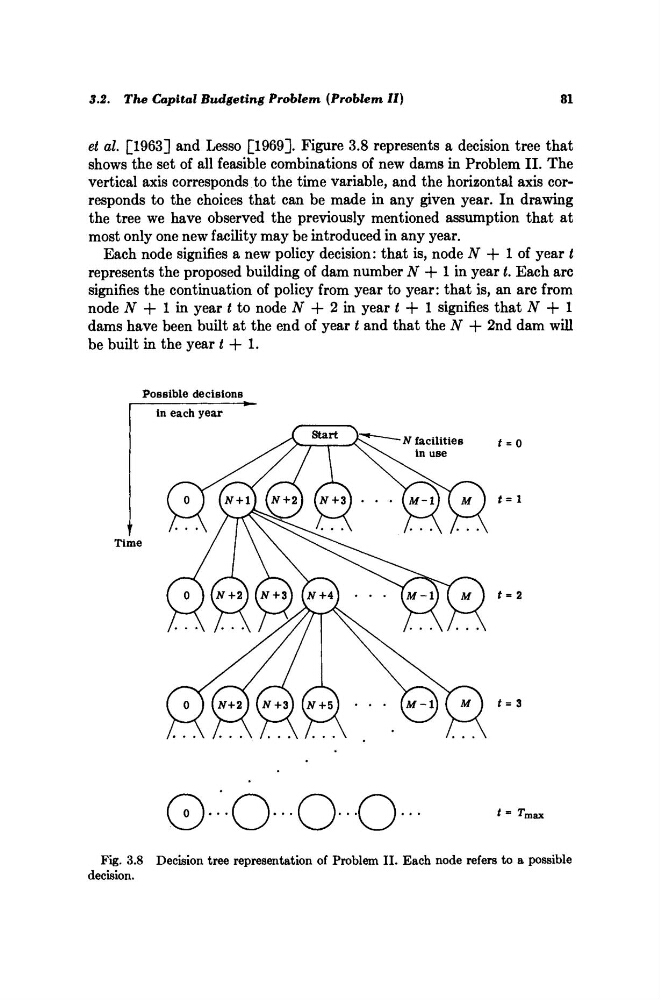
et al. [1963] and Lesso [1969]. Figure 3.8 represents a decision tree that
shows the set of all feasible combinations of new dams in Problem II. The
vertical axis corresponds to the time variable, and the horizontal axis corresponds to the choices that can be made in any given year. In drawing
the tree we have observed the previously mentioned assumption that at
most only one new facility may be introduced in any year.
Each node signifies a new policy decision: that is, node Ν + 1 of year t
represents the proposed building of dam number Ν + 1 in year t. Each arc
signifies the continuation of policy from year to year: that is, an arc from
node Ν + 1 in year t to node Ν + 2 in year t + 1 signifies that Ν -f 1
dams have been built at the end of year t and that the Ν + 2nd dam will
be built in the year t + 1.
Possible decisions
in each year
Time
t = 3
*= 1
t = 2
t = 0
max
Fig. 3.8 Decision tree representation of Problem II. Each node refers to a possible
decision.
II)
81
et al. [1963] and Lesso [1969]. Figure 3.8 represents a decision tree that
shows the set of all feasible combinations of new dams in Problem II. The
vertical axis corresponds to the time variable, and the horizontal axis corresponds to the choices that can be made in any given year. In drawing
the tree we have observed the previously mentioned assumption that at
most only one new facility may be introduced in any year.
Each node signifies a new policy decision: that is, node Ν + 1 of year t
represents the proposed building of dam number Ν + 1 in year t. Each arc
signifies the continuation of policy from year to year: that is, an arc from
node Ν + 1 in year t to node Ν + 2 in year t + 1 signifies that Ν -f 1
dams have been built at the end of year t and that the Ν + 2nd dam will
be built in the year t + 1.
Possible decisions
in each year
Time
t = 3
*= 1
t = 2
t = 0
max
Fig. 3.8 Decision tree representation of Problem II. Each node refers to a possible
decision.