

VI. DESERT ARTHROPODS
317
Temperature (°F)
32 40 50 60 70 80 90 100 110 120
80
70
Γ 60
E
E
o
a
σ 30
20
10
°0
10
20
30
40
50
Temperature (°C)
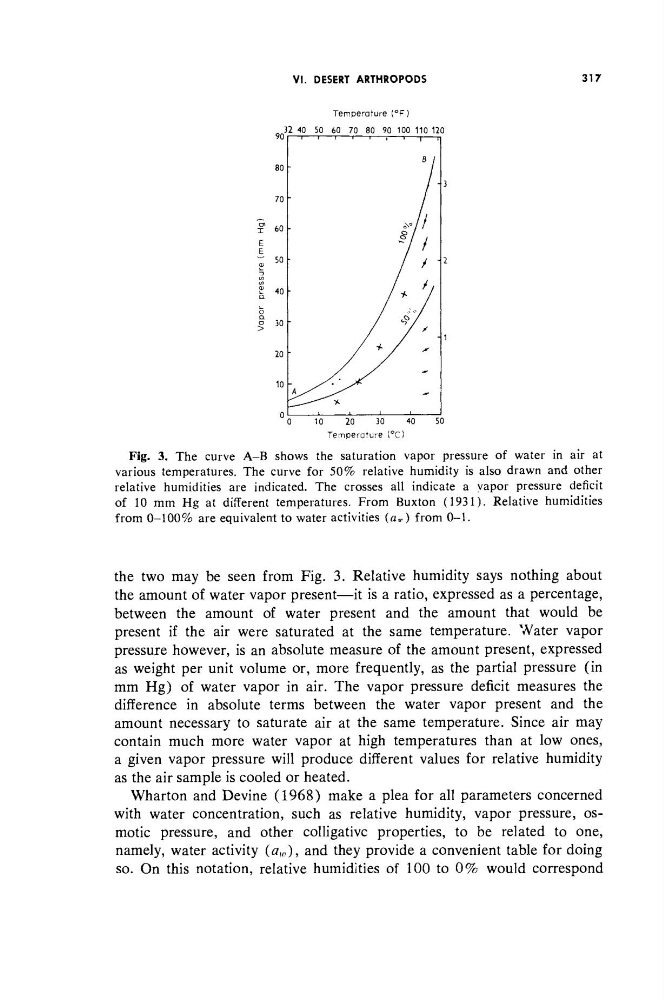
Fig. 3. The curve A-B shows the saturation vapor pressure of water in air at
various temperatures. The curve for 50% relative humidity is also drawn and other
relative humidities are indicated. The crosses all indicate a vapor pressure deficit
of 10 mm H g at different temperatures. From Buxton (1931). Relative humidities
from 0-100% are equivalent to water activities (a ir ) from 0-1.
the two may be seen from Fig. 3. Relative humidity says nothing about
the amount of water vapor present—it is a ratio, expressed as a percentage,
between the amount of water present and the amount that would be
present if the air were saturated at the same temperature. Water vapor
pressure however, is an absolute measure of the amount present, expressed
as weight per unit volume or, more frequently, as the partial pressure (in
mm Hg) of water vapor in air. The vapor pressure deficit measures the
difference in absolute terms between the water vapor present and the
amount necessary to saturate air at the same temperature. Since air may
contain much more water vapor at high temperatures than at low ones,
a given vapor pressure will produce different values for relative humidity
as the air sample is cooled or heated.
Wharton and Devine (1968) make a plea for all parameters concerned
with water concentration, such as relative humidity, vapor pressure, osmotic pressure, and other colligative properties, to be related to one,
namely, water activity (a w ), and they provide a convenient table for doing
so. On this notation, relative humidities of 100 to 0% would correspond
317
Temperature (°F)
32 40 50 60 70 80 90 100 110 120
80
70
Γ 60
E
E
o
a
σ 30
20
10
°0
10
20
30
40
50
Temperature (°C)
Fig. 3. The curve A-B shows the saturation vapor pressure of water in air at
various temperatures. The curve for 50% relative humidity is also drawn and other
relative humidities are indicated. The crosses all indicate a vapor pressure deficit
of 10 mm H g at different temperatures. From Buxton (1931). Relative humidities
from 0-100% are equivalent to water activities (a ir ) from 0-1.
the two may be seen from Fig. 3. Relative humidity says nothing about
the amount of water vapor present—it is a ratio, expressed as a percentage,
between the amount of water present and the amount that would be
present if the air were saturated at the same temperature. Water vapor
pressure however, is an absolute measure of the amount present, expressed
as weight per unit volume or, more frequently, as the partial pressure (in
mm Hg) of water vapor in air. The vapor pressure deficit measures the
difference in absolute terms between the water vapor present and the
amount necessary to saturate air at the same temperature. Since air may
contain much more water vapor at high temperatures than at low ones,
a given vapor pressure will produce different values for relative humidity
as the air sample is cooled or heated.
Wharton and Devine (1968) make a plea for all parameters concerned
with water concentration, such as relative humidity, vapor pressure, osmotic pressure, and other colligative properties, to be related to one,
namely, water activity (a w ), and they provide a convenient table for doing
so. On this notation, relative humidities of 100 to 0% would correspond