

S 1 I A U Y - S T A T 1 STAB1.C W ) U S I ) A K Y I.AYER
75
RI
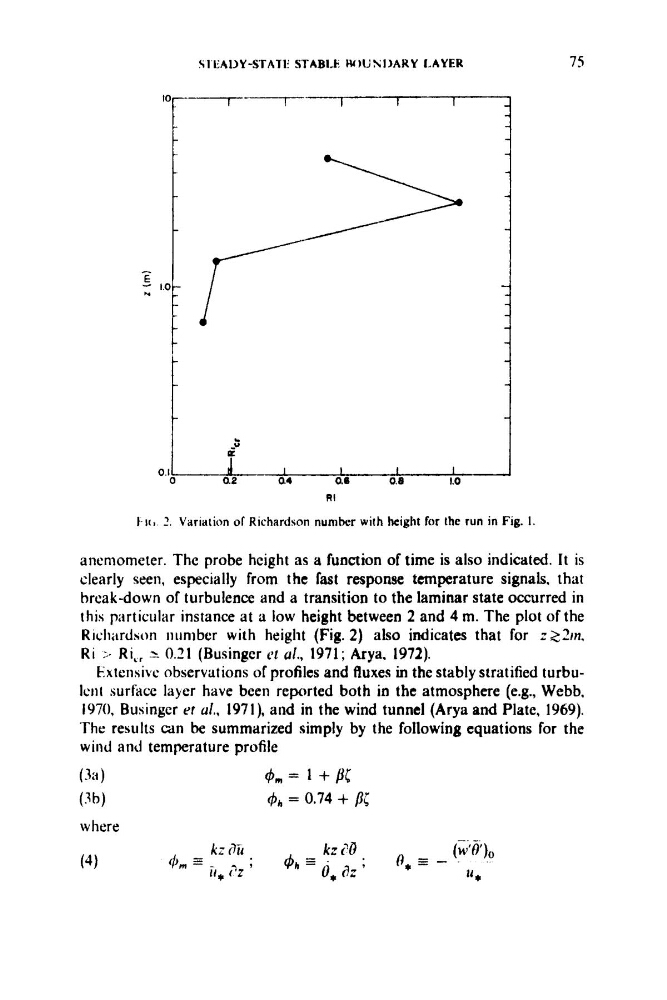
I-K,. 2. Variation of Richardson number with height for the run in Fig. I.
anemometer. The probe height as a function of time is also indicated. It is
clearly seen, especially from the fast response temperature signals. that
breakdown of turbulence and a transition to the laminar state occurred in
this particular instance at a low height between 2 and 4 m. The plot of the
Ricli;trdaon iiumber with height (Fig. 2) also indicates that for z 2 2 m
Ri I-. Ri,, r 0.21 (Businger cl ul., 1971; Arya. 1972).
Extenskc observations of profiles and fluxes in the stably stratified turbulent surface layer have been reported both in the atmosphere (e.g., Webb,
1970, Businger et ul., 1971), and in the wind tunnel (Arya and Plate, 1969).
'The results a n be summarized simply by the following equations for the
wind and temperature profile
75
RI
I-K,. 2. Variation of Richardson number with height for the run in Fig. I.
anemometer. The probe height as a function of time is also indicated. It is
clearly seen, especially from the fast response temperature signals. that
breakdown of turbulence and a transition to the laminar state occurred in
this particular instance at a low height between 2 and 4 m. The plot of the
Ricli;trdaon iiumber with height (Fig. 2) also indicates that for z 2 2 m
Ri I-. Ri,, r 0.21 (Businger cl ul., 1971; Arya. 1972).
Extenskc observations of profiles and fluxes in the stably stratified turbulent surface layer have been reported both in the atmosphere (e.g., Webb,
1970, Businger et ul., 1971), and in the wind tunnel (Arya and Plate, 1969).
'The results a n be summarized simply by the following equations for the
wind and temperature profile