

74
JWBT A. BUSJNGEK AND S. P. S. ARYA
we must have ?g,i: > 25 C/m, which is a very large temperature gradient
indeed. 'The value of Ri,, near the surface is probably larger than the value in
the free stream, but the order of magnitude will not change.
The preceding argument is given to illustrate the likelihood of turbulence
near the surface in the stable boundary layer under most conditions.
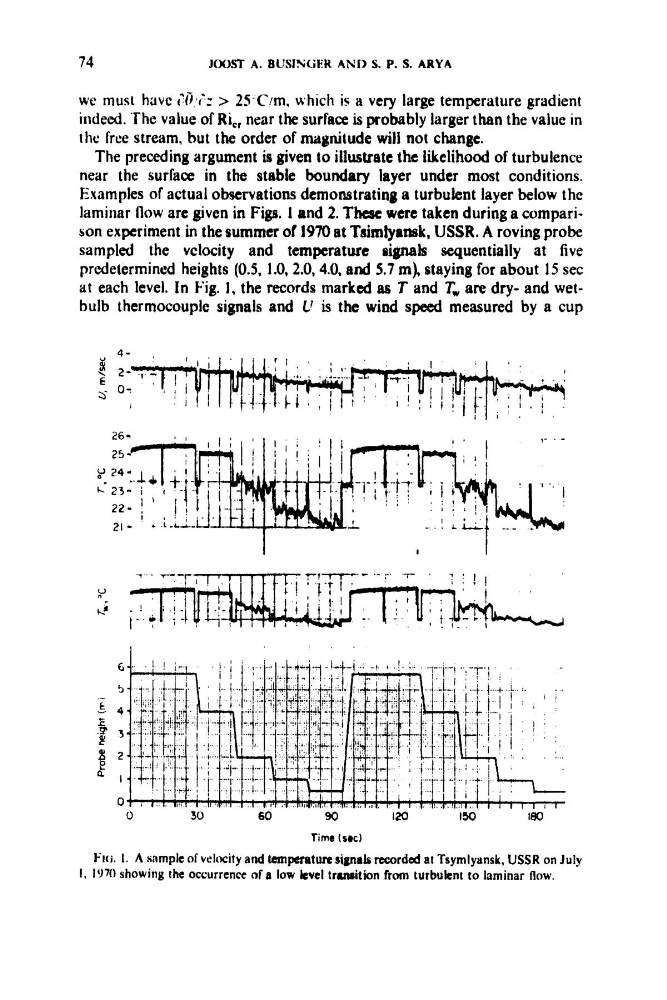
Examples of actual observations demonstrating a turbulent layer below the
lamiliar llow are given in Figs. 1 and 2. T h e were taken during a comparison experiment in the summer of 1970 at Tsimlyansk, USSR. A roving probe
sampled the vclocity and temperature aignals sequentially at five
predetermined heights (0.5, 1.0, 2.0,4.0, and 5.7 m), staying for about 15 sec
at each level. In Fig. 1, the records marked as T and T, are dry- and wetbulb thermocouple signals and Lr is the wind speed measured by a cup
€4
5
.5 4
i
p 3
B 2
& I
0
30
60
90
I20
Time (stc)
FIG. 1. A sample of velocity and temperature signals recorded at Tsymlyanok, USSR on July
I, 1970 showing the occurrence nf a low kvel transition from turbulent to laminar Row.
JWBT A. BUSJNGEK AND S. P. S. ARYA
we must have ?g,i: > 25 C/m, which is a very large temperature gradient
indeed. 'The value of Ri,, near the surface is probably larger than the value in
the free stream, but the order of magnitude will not change.
The preceding argument is given to illustrate the likelihood of turbulence
near the surface in the stable boundary layer under most conditions.
Examples of actual observations demonstrating a turbulent layer below the
lamiliar llow are given in Figs. 1 and 2. T h e were taken during a comparison experiment in the summer of 1970 at Tsimlyansk, USSR. A roving probe
sampled the vclocity and temperature aignals sequentially at five
predetermined heights (0.5, 1.0, 2.0,4.0, and 5.7 m), staying for about 15 sec
at each level. In Fig. 1, the records marked as T and T, are dry- and wetbulb thermocouple signals and Lr is the wind speed measured by a cup
€4
5
.5 4
i
p 3
B 2
& I
0
30
60
90
I20
Time (stc)
FIG. 1. A sample of velocity and temperature signals recorded at Tsymlyanok, USSR on July
I, 1970 showing the occurrence nf a low kvel transition from turbulent to laminar Row.