

DIFFUSION COEFFICIENT OF THERMAL POLLUTION
387
TARLE 111. 7;. u:. and u,
u: (10' m*)
u, (10' m)
.u(m)
T , ( C )
Left
Right
Left
Right
100
6.6
0.26
0.54
0.51
0.74
200
6.3
0.91
0.91
0.95
0.95
300
5.7
2.47
1.60
1.57
1.26
400
4.x
4.53
1.36
2.13
1.17
hoo
3.6
5.44
1.60
2.33
1.26
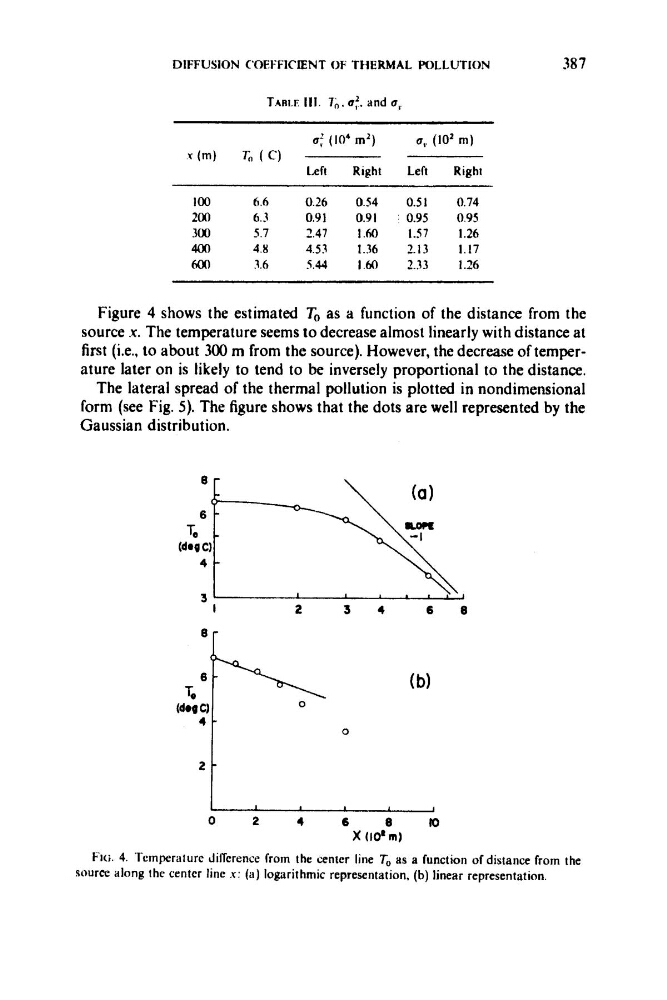
Figure 4 shows the estimated To as a function of the distance from the
source .x. The temperature seems to decrease almost linearly with distance at
first (i.e., to about 300 m from the source). However, the decrease of temperature later on is likely to tend to be inversely proportional to the distance.
The lateral spread of the thermal pollution is plotted in nondimensional
form (see Fig. 5). The figure shows that the dots are well represented by the
Gaussian distribution.
'
'
i
'
i
:
3
I
2
3
4
6
8
1
I
I
1
0
2
4
6
8
K
)
X (10' m)
Pic;. 4. 'Temperature dilrcrenoe from the e n t e r line To as a function of distance from the
source along the center line x: (a) logarithmic representation. (b) linear representation.
387
TARLE 111. 7;. u:. and u,
u: (10' m*)
u, (10' m)
.u(m)
T , ( C )
Left
Right
Left
Right
100
6.6
0.26
0.54
0.51
0.74
200
6.3
0.91
0.91
0.95
0.95
300
5.7
2.47
1.60
1.57
1.26
400
4.x
4.53
1.36
2.13
1.17
hoo
3.6
5.44
1.60
2.33
1.26
Figure 4 shows the estimated To as a function of the distance from the
source .x. The temperature seems to decrease almost linearly with distance at
first (i.e., to about 300 m from the source). However, the decrease of temperature later on is likely to tend to be inversely proportional to the distance.
The lateral spread of the thermal pollution is plotted in nondimensional
form (see Fig. 5). The figure shows that the dots are well represented by the
Gaussian distribution.
'
'
i
'
i
:
3
I
2
3
4
6
8
1
I
I
1
0
2
4
6
8
K
)
X (10' m)
Pic;. 4. 'Temperature dilrcrenoe from the e n t e r line To as a function of distance from the
source along the center line x: (a) logarithmic representation. (b) linear representation.