

DIFFUSION OF OCEANIC HEAT AND MOMENTUM
36 7
and out of a layer. Maximum turbulence under the wave crests would imply
that the turbulence layer is grazed at the top of the package motion cycle,
which seems improbable.
The former explanation, namely that the ”turbulence” is simply noise
induced by the package motion, seemed the most likely at first. However,
there is another set of published temperature and velocity derivative data
taken in a mixed layer where the “package” was a submarine and would not
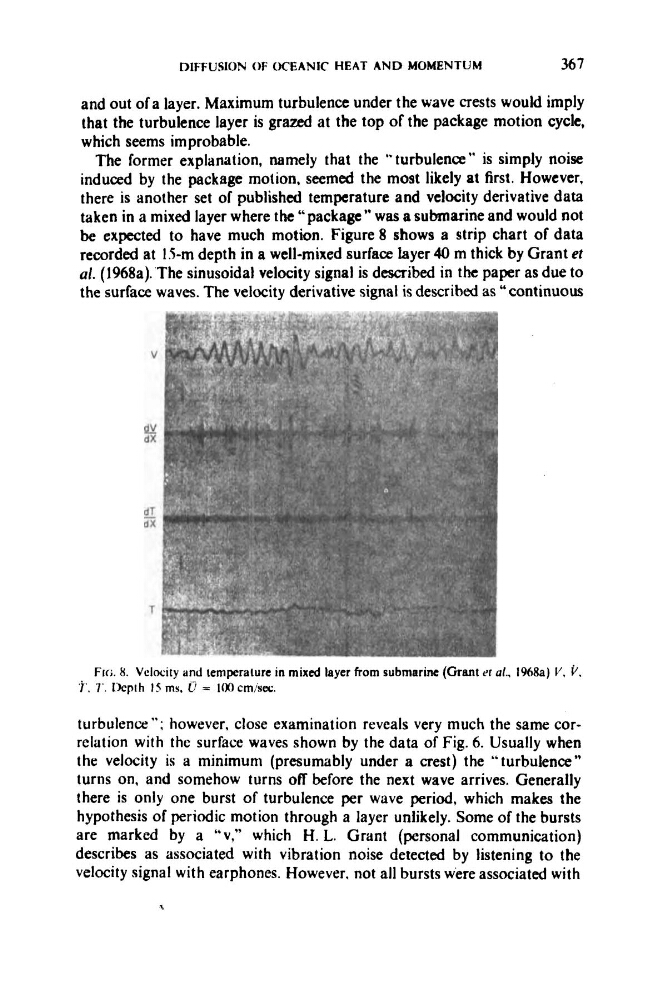
be expected to have much motion. Figure 8 shows a strip chart of data
recorded at IS-m depth in a well-mixed surface layer 40 m thick by Grant et
ul. (1968a). The sinusoidal velocity signal is described in the paper as due to
the surface waves. The velocity derivative signal is described as “continuous
Fia. 8. Velocity and temperature in mixed layer from submarine (Grant zr al., 1968a) 1’ . V .
‘f, 7‘. Dcpth 15 ms. l7 = I00 cm:sex.
turbulence”; however, close examination reveals very much the same correlation with the surface waves shown by the data of Fig. 6. Usually when
the velocity is a minimum (presumably under a crest) the “turbulence”
turns on, and somehow turns off before the next wave arrives. Generally
there is only one burst of turbulence per wave period, which makes the
hypothesis of periodic motion through a layer unlikely. Some of the bursts
are marked by a “v,” which H. L. Grant (personal communication)
describes as associated with vibration noise detected by listening to the
velocity signal with earphones. However. not all bursts were associated with
36 7
and out of a layer. Maximum turbulence under the wave crests would imply
that the turbulence layer is grazed at the top of the package motion cycle,
which seems improbable.
The former explanation, namely that the ”turbulence” is simply noise
induced by the package motion, seemed the most likely at first. However,
there is another set of published temperature and velocity derivative data
taken in a mixed layer where the “package” was a submarine and would not
be expected to have much motion. Figure 8 shows a strip chart of data
recorded at IS-m depth in a well-mixed surface layer 40 m thick by Grant et
ul. (1968a). The sinusoidal velocity signal is described in the paper as due to
the surface waves. The velocity derivative signal is described as “continuous
Fia. 8. Velocity and temperature in mixed layer from submarine (Grant zr al., 1968a) 1’ . V .
‘f, 7‘. Dcpth 15 ms. l7 = I00 cm:sex.
turbulence”; however, close examination reveals very much the same correlation with the surface waves shown by the data of Fig. 6. Usually when
the velocity is a minimum (presumably under a crest) the “turbulence”
turns on, and somehow turns off before the next wave arrives. Generally
there is only one burst of turbulence per wave period, which makes the
hypothesis of periodic motion through a layer unlikely. Some of the bursts
are marked by a “v,” which H. L. Grant (personal communication)
describes as associated with vibration noise detected by listening to the
velocity signal with earphones. However. not all bursts were associated with