

i > i l F U S l O ~ OF (X'EANIC' HEAT AND MOMENTUM
365
Il-*-n
TEYClUTUL Z
TOWING: 18.3m, IN cmlsec, 090.
SEA: 2m, 260', choopy
WIND: 600an/sec, 196O
TWWO '
r=
mw WYLO
DATE: 012041-16-72
mIlll
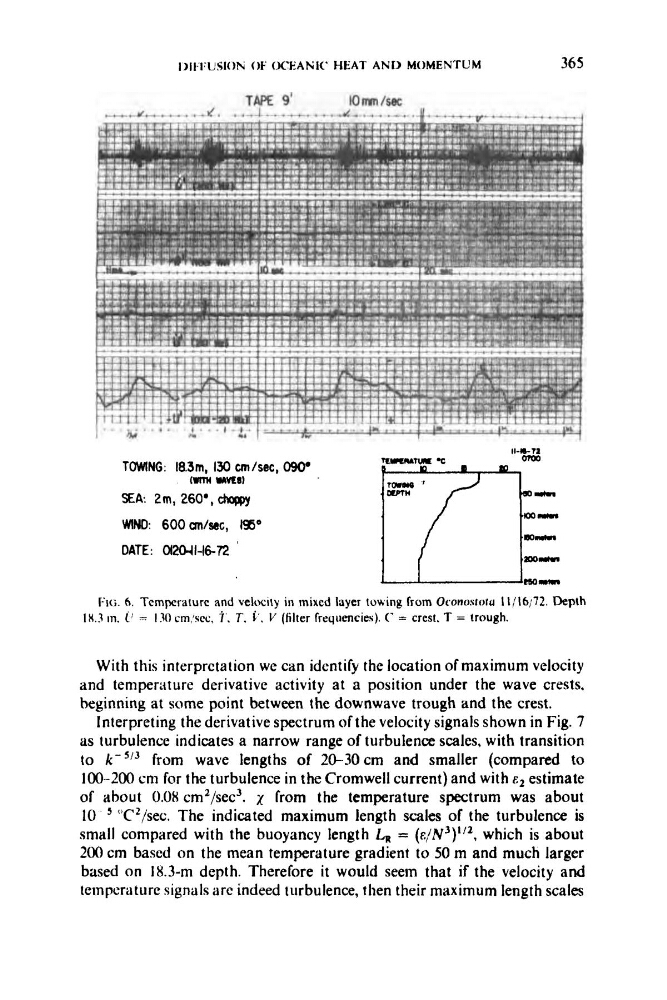
FIG. 6. Temperature and velocity in mixed layer towing from Oconosroru I1/16;72. Depth
IK.3 in. = I30 cm:scc, j ' . T , i'. c' (filter frequencies). C = crest. T = trough.
With this interpretation we can identify the location of maximum velocity
and temperuture derivative activity at a position under the wave crests,
beginning at some point between the downwave trough and the crest.
Interpreting the derivative spectrum of the velocity signals shown in Fig. 7
as turbulence indicates a narrow range of turbulence scales, with transition
to
from wave lengths of 20-30cm and smaller (compared to
100-200 cm for the turbulence in the Cromwell current) and with e2 estimate
of about 0.08 cm2/sec3. from the temperature spectrum was about
1 0 ' "C*/sec. The indicated maximum length scales of the turbulence is
small compared with the buoyancy length LR = ( c / N ~ ) " ~ ,
which is about
200 cm based on the mean temperature gradient to 50 m and much larger
based on 18.3-m depth. Therefore it would seem that if the velocity and
tetnperature signals are indeed turbulence, then their maximum length scales
365
Il-*-n
TEYClUTUL Z
TOWING: 18.3m, IN cmlsec, 090.
SEA: 2m, 260', choopy
WIND: 600an/sec, 196O
TWWO '
r=
mw WYLO
DATE: 012041-16-72
mIlll
FIG. 6. Temperature and velocity in mixed layer towing from Oconosroru I1/16;72. Depth
IK.3 in. = I30 cm:scc, j ' . T , i'. c' (filter frequencies). C = crest. T = trough.
With this interpretation we can identify the location of maximum velocity
and temperuture derivative activity at a position under the wave crests,
beginning at some point between the downwave trough and the crest.
Interpreting the derivative spectrum of the velocity signals shown in Fig. 7
as turbulence indicates a narrow range of turbulence scales, with transition
to
from wave lengths of 20-30cm and smaller (compared to
100-200 cm for the turbulence in the Cromwell current) and with e2 estimate
of about 0.08 cm2/sec3. from the temperature spectrum was about
1 0 ' "C*/sec. The indicated maximum length scales of the turbulence is
small compared with the buoyancy length LR = ( c / N ~ ) " ~ ,
which is about
200 cm based on the mean temperature gradient to 50 m and much larger
based on 18.3-m depth. Therefore it would seem that if the velocity and
tetnperature signals are indeed turbulence, then their maximum length scales