

MIXING RATE AND TEMPERATURE IN STRATIFIED WATERS
343
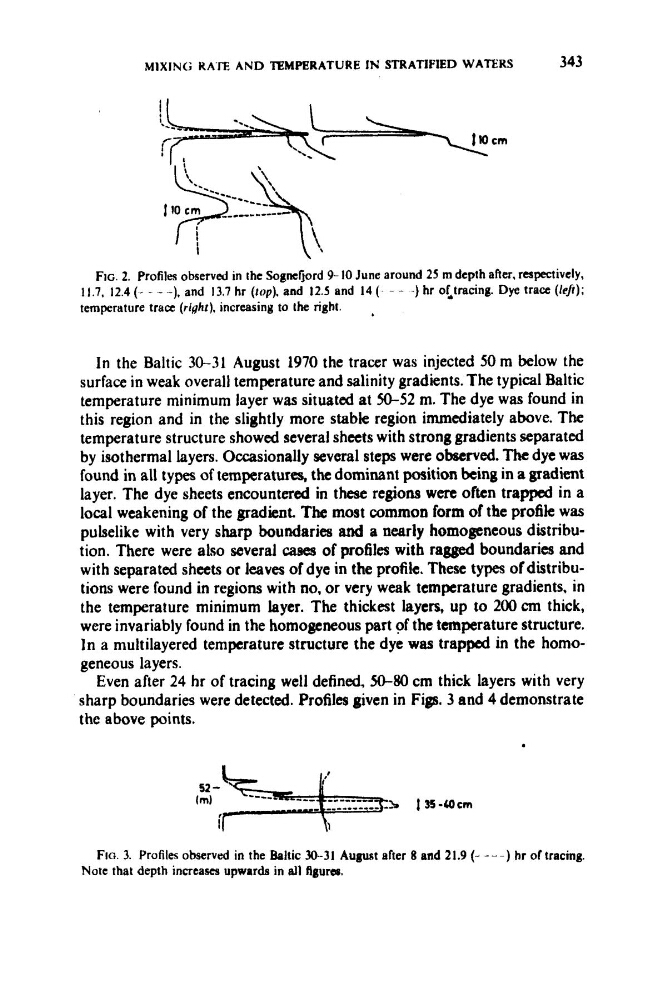
FIG. 2. Profiles observed in the SogmrJord 9- 10 June around 25 m depth after, respectively,
11.7. 12.4 ( - - - -), and 13.7 hr (top), and 12.5 and 14 ( - - -) hr oltrachg. Dye trace (lef?);
temperature trace (right), increasing to the right.
,
In the Baltic 30-31 August 1970 the tracer was injected 50 m below the
surface in weak overall temperature and salinity gradients. The typical Baltic
temperature minimum layer was situated at 50-52 m. The dye was found in
this region and in the slightly more stable region immediately above. The
temperature structure showed several sheets with strong gradients separated
by isothermal layers. Occasionally several steps were observed. The dye was
found in all types of temperatures, the dominant position being in a gradient
layer. The dye sheets encountered in these regions were often trapped in a
local weakening of the gradient. The most common form of the profile was
pulselike with very sharp boundaries and a nearly homogeneous distribution. There were also several cases of profiles with ragged boundaries and
with separated sheets or leaves of dye in the profile. These types of distributions were found in regions with no, or very weak temperature gradients, in
the temperature minimum layer. The thickest layers, up to 200cm thick,
were invariably found in the homogeneous part of the temperature structure.
In a multilayered temperature structure the dye was trapped in the homogeneous layers.
Even after 24 hr of tracing well defined, 50-80 cm thick layers with very
sharp boundaries were detected. Profiles given in Figs. 3 and 4 demonstrate
the above points.
FIG. 3. Profiles observed in the Baltic 30-31 August after 8 and 21.9 (- - - - ) hr of tracing.
Note that depth increases upwards in all Rgum.
343
FIG. 2. Profiles observed in the SogmrJord 9- 10 June around 25 m depth after, respectively,
11.7. 12.4 ( - - - -), and 13.7 hr (top), and 12.5 and 14 ( - - -) hr oltrachg. Dye trace (lef?);
temperature trace (right), increasing to the right.
,
In the Baltic 30-31 August 1970 the tracer was injected 50 m below the
surface in weak overall temperature and salinity gradients. The typical Baltic
temperature minimum layer was situated at 50-52 m. The dye was found in
this region and in the slightly more stable region immediately above. The
temperature structure showed several sheets with strong gradients separated
by isothermal layers. Occasionally several steps were observed. The dye was
found in all types of temperatures, the dominant position being in a gradient
layer. The dye sheets encountered in these regions were often trapped in a
local weakening of the gradient. The most common form of the profile was
pulselike with very sharp boundaries and a nearly homogeneous distribution. There were also several cases of profiles with ragged boundaries and
with separated sheets or leaves of dye in the profile. These types of distributions were found in regions with no, or very weak temperature gradients, in
the temperature minimum layer. The thickest layers, up to 200cm thick,
were invariably found in the homogeneous part of the temperature structure.
In a multilayered temperature structure the dye was trapped in the homogeneous layers.
Even after 24 hr of tracing well defined, 50-80 cm thick layers with very
sharp boundaries were detected. Profiles given in Figs. 3 and 4 demonstrate
the above points.
FIG. 3. Profiles observed in the Baltic 30-31 August after 8 and 21.9 (- - - - ) hr of tracing.
Note that depth increases upwards in all Rgum.