

REYNOI.l>S STRESS STRUCTURE IN TURBULENT B O U N D A R Y LAYER
309
10 -
I
I
L
1
I
I
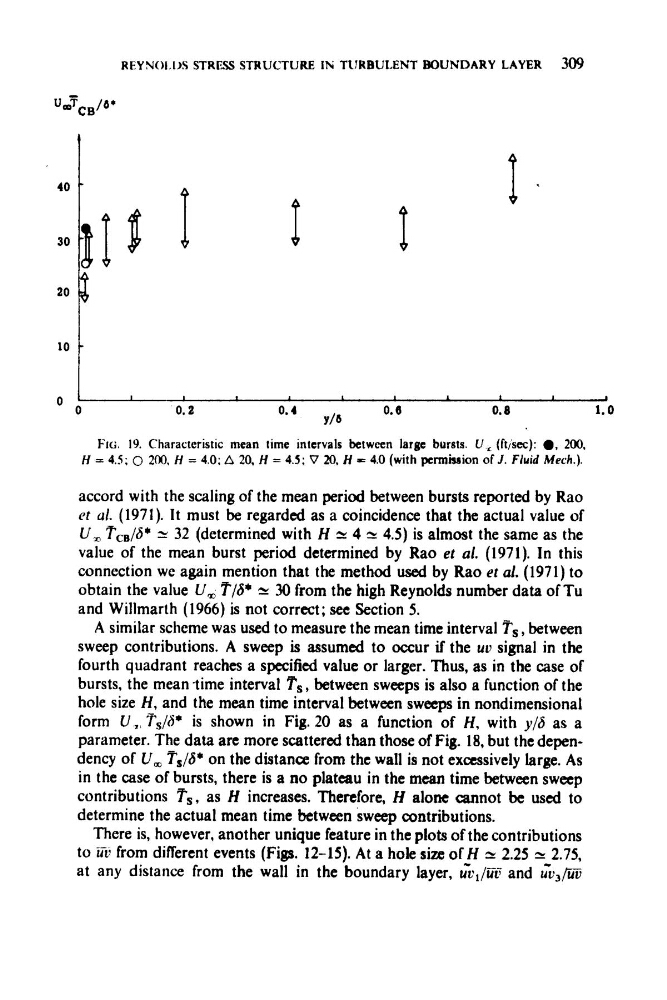
accord with the scaling of the mean period between bursts reported by Rao
er al. (1971). It must be regarded as a coincidence that the actual value of
U , ifCB/d* = 32 (determined with H 1: 4 = 4.5) is almost the same as the
value of the mean burst period determined by Rao et al. (1971). In this
connection we again mention that the method used by Rao et al. (1971) to
obtain the value U , T/S* 'v 30 from the high Reynolds number data of Tu
and Willmarth (1966) is not correct; see Section 5.
A similar scheme was used to measure the mean time interval Ts, between
sweep contributions. A sweep is assumed to occur if the uo signal in the
fourth quadrant reaches a specified value or larger. Thus, as in the case of
bursts, the meantime interval TS, between sweeps is also a function of the
hole size H, and the mean time interval between sweeps in nondimensional
form U ~ TS/d* is shown in Fig. 20 as a function of H, with y/S as a
parameter. The data are more scattered than those of Fig. 18, but the dependency of U , Ts/6* on the distance from the wall is not excessively large. As
in the case of bursts, there is a no plateau in the mean time between sweep
contributions Ts, as H increases. Therefore, H alone cannot be used to
determine the actual mean time between sweep Contributions.
There is, however, another unique feature in the plots of the contributions
to ziir from different events (Figs. 12-15). At a hole size of H 'c 2.25 z 2.75,
at any distance from the wall in the boundary layer, &Jii~? and i&iijj
309
10 -
I
I
L
1
I
I
accord with the scaling of the mean period between bursts reported by Rao
er al. (1971). It must be regarded as a coincidence that the actual value of
U , ifCB/d* = 32 (determined with H 1: 4 = 4.5) is almost the same as the
value of the mean burst period determined by Rao et al. (1971). In this
connection we again mention that the method used by Rao et al. (1971) to
obtain the value U , T/S* 'v 30 from the high Reynolds number data of Tu
and Willmarth (1966) is not correct; see Section 5.
A similar scheme was used to measure the mean time interval Ts, between
sweep contributions. A sweep is assumed to occur if the uo signal in the
fourth quadrant reaches a specified value or larger. Thus, as in the case of
bursts, the meantime interval TS, between sweeps is also a function of the
hole size H, and the mean time interval between sweeps in nondimensional
form U ~ TS/d* is shown in Fig. 20 as a function of H, with y/S as a
parameter. The data are more scattered than those of Fig. 18, but the dependency of U , Ts/6* on the distance from the wall is not excessively large. As
in the case of bursts, there is a no plateau in the mean time between sweep
contributions Ts, as H increases. Therefore, H alone cannot be used to
determine the actual mean time between sweep Contributions.
There is, however, another unique feature in the plots of the contributions
to ziir from different events (Figs. 12-15). At a hole size of H 'c 2.25 z 2.75,
at any distance from the wall in the boundary layer, &Jii~? and i&iijj