

308
W. W. WILLMAWTH AND S. S. LU
-
Y
0
A
'
Po
1
0
S
HOIC ire, n
10
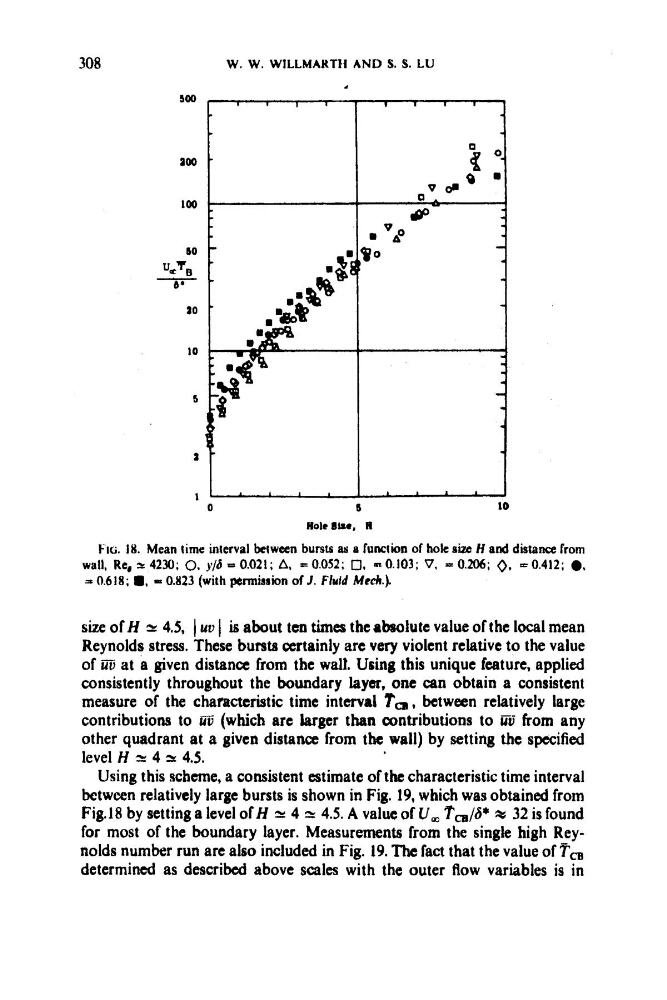
FIG. 18. Mean time interval between bursts M a function of hole sizC H and distance from
wail, Re, * 4230; 0, y/S = 0.021; A. = 0.052; 0. n0.103; V, * 0.206; 0, = 0.412; 0.
= 0.618; ., E 0.823 (with permission of J . Fluid Me&.).
size of H Y 4.5, I uv I is about ten times theabsolute value of the local mean
Reynolds stress. These bursts cxrtainly are very violent relative to the value
of i@ at a given distance from the walk Using this unique feature, applied
consistently throughout the boundary layer, one can obtain a consistent
measure of the characteristic time interval Tm, between relatively large
contributions to
(which are larger than contributions to iiij from any
other quadrant at a given distance from the wall) by setting the specified
level H 2 4 2 4.5.
Using this scheme, a consistent estimate of the characteristic time interval
between relatively large bursts is shown in Fig. 19, which was obtained from
Fig.18 by setting a level of H 2c 4 = 4.5. A value of U, Ta/ij* 32 is found
for most of the boundary layer. Measurements from the single high Reynolds number run are also included in Fig. 19. The fact that the value of Ta
determined as described above scales with the outer flow variables is in
W. W. WILLMAWTH AND S. S. LU
-
Y
0
A
'
Po
1
0
S
HOIC ire, n
10
FIG. 18. Mean time interval between bursts M a function of hole sizC H and distance from
wail, Re, * 4230; 0, y/S = 0.021; A. = 0.052; 0. n0.103; V, * 0.206; 0, = 0.412; 0.
= 0.618; ., E 0.823 (with permission of J . Fluid Me&.).
size of H Y 4.5, I uv I is about ten times theabsolute value of the local mean
Reynolds stress. These bursts cxrtainly are very violent relative to the value
of i@ at a given distance from the walk Using this unique feature, applied
consistently throughout the boundary layer, one can obtain a consistent
measure of the characteristic time interval Tm, between relatively large
contributions to
(which are larger than contributions to iiij from any
other quadrant at a given distance from the wall) by setting the specified
level H 2 4 2 4.5.
Using this scheme, a consistent estimate of the characteristic time interval
between relatively large bursts is shown in Fig. 19, which was obtained from
Fig.18 by setting a level of H 2c 4 = 4.5. A value of U, Ta/ij* 32 is found
for most of the boundary layer. Measurements from the single high Reynolds number run are also included in Fig. 19. The fact that the value of Ta
determined as described above scales with the outer flow variables is in