

Rt!YNOI.I)S STRESS STRllCTURE IN TURRUI-ENT B O U N D A R Y LAYER 293
uv t
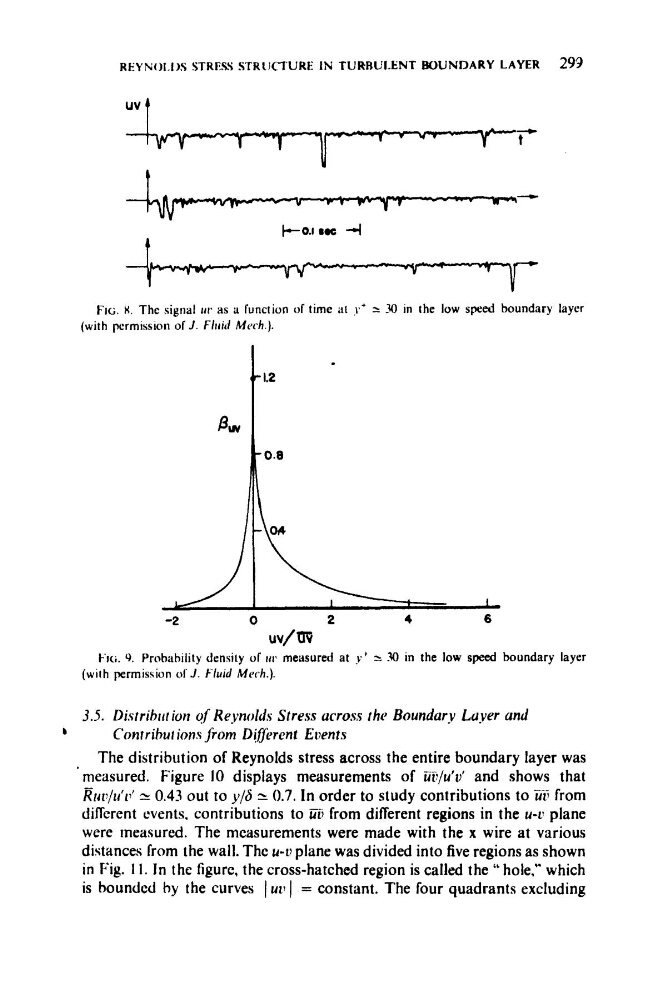
FIG. K. The signal ui’ as a function of time it1 15’ 2 30 in the low sped boundary layer
(with permission of J . Fliritl Mech ).
uv/m
Fic;. 9. Probability density of iw measured at y t 4 -30 in the low speed boundary layer
(with permission of J . Fluid M d i . ) .
3.5. Distrihiir ion qf Reynolds Stress ucross the Boundurv Luyer and
b
Contrihut ions from DifSrrent Events
The distribution of Reynolds stress across the entire boundary layer was
measured. Figure 10 displays measurements of iiP/u’u’ and shows that
Rrw/u‘v’ 2 0.43 out to y/S 2 0.7. In order to study contributions to Ud from
different events. contributions to i i z ~ from different regions in the u-r plane
were measured. The measurements were made with the x wire at various
distances from the wall. The u-t? plane was divided into five regions as shown
in Fig. 11. In the figure, the cross-hatched region is called the ‘I hole,” which
is bounded by the curves 1 U P I = constant. The four quadrants excluding
uv t
FIG. K. The signal ui’ as a function of time it1 15’ 2 30 in the low sped boundary layer
(with permission of J . Fliritl Mech ).
uv/m
Fic;. 9. Probability density of iw measured at y t 4 -30 in the low speed boundary layer
(with permission of J . Fluid M d i . ) .
3.5. Distrihiir ion qf Reynolds Stress ucross the Boundurv Luyer and
b
Contrihut ions from DifSrrent Events
The distribution of Reynolds stress across the entire boundary layer was
measured. Figure 10 displays measurements of iiP/u’u’ and shows that
Rrw/u‘v’ 2 0.43 out to y/S 2 0.7. In order to study contributions to Ud from
different events. contributions to i i z ~ from different regions in the u-r plane
were measured. The measurements were made with the x wire at various
distances from the wall. The u-t? plane was divided into five regions as shown
in Fig. 11. In the figure, the cross-hatched region is called the ‘I hole,” which
is bounded by the curves 1 U P I = constant. The four quadrants excluding