

298
W. W. WILLMARTH AND S. S. LU
remained below these levels for approximately the same time, and both
contributed approximately the same value to the integrals of u , , , and u,,
with respect to time during the time uWr and uw2 wm below the level 4, and
uL1. With this elaborate procedure we found ten events meeting these
criteria in 52 sec o f d i g i W data (4.1 x lo5 Uigitizcd data points)
For each event, the uu signal was examinad and it wag found that in each
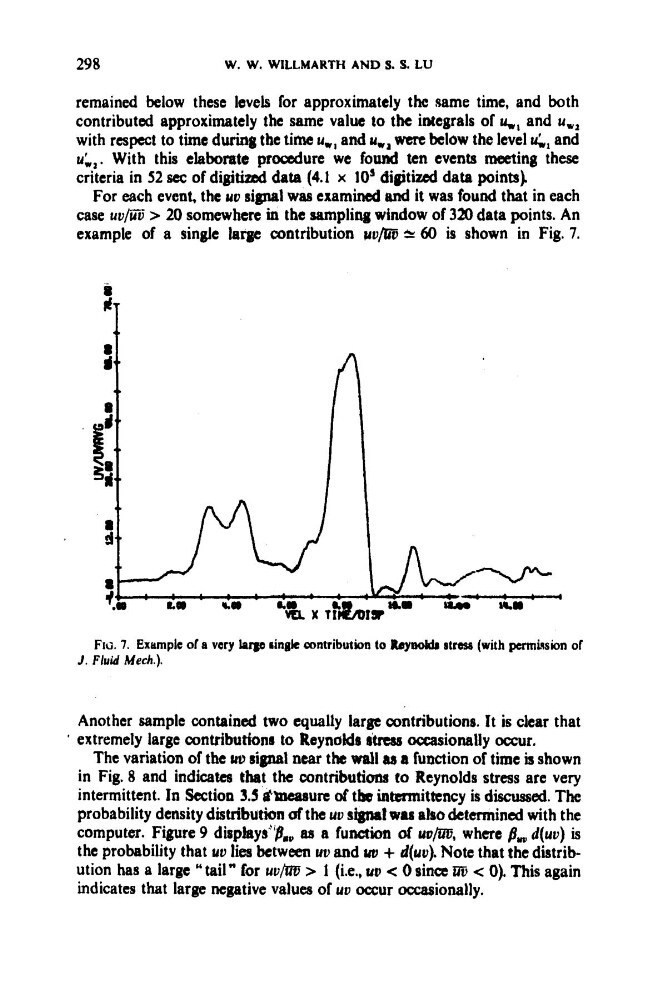
case uu@ > 20 somewhere in the sampling window of 320 data points. An
example of a single large contribution uuFrr, * 60 is shown in Fig. 7.
FIG 7. Exumple of a vary I p q e tingk contribution to R o y W stress (with permbsion of
J . Fluid Mech.).
Another sample contained two equally large contributions. It is clear that
The variation of the uv signal near the wall M a function of time is shown
in Fig. 8 and indicates that the contributions to Reynolds stress are very
intermittent. In Section 3.5 CP' Deasure of thd inmittency is discussed. The
probability density distribution af the uu s w l was a h determined with the
computer. Figure 9
as a function of uo/ii?j, where /3
, d(uu) is
the probability that uu lies between wu and uv + d(uo). Note that the distribution has a large tail for uu/ao > 1 ( i e , uu < 0 since t@ < 0). This again
indicates that large negative values of uu occur Occasionally.
' extremely large contributionr to ReynaMs stress occasionally occur.
W. W. WILLMARTH AND S. S. LU
remained below these levels for approximately the same time, and both
contributed approximately the same value to the integrals of u , , , and u,,
with respect to time during the time uWr and uw2 wm below the level 4, and
uL1. With this elaborate procedure we found ten events meeting these
criteria in 52 sec o f d i g i W data (4.1 x lo5 Uigitizcd data points)
For each event, the uu signal was examinad and it wag found that in each
case uu@ > 20 somewhere in the sampling window of 320 data points. An
example of a single large contribution uuFrr, * 60 is shown in Fig. 7.
FIG 7. Exumple of a vary I p q e tingk contribution to R o y W stress (with permbsion of
J . Fluid Mech.).
Another sample contained two equally large contributions. It is clear that
The variation of the uv signal near the wall M a function of time is shown
in Fig. 8 and indicates that the contributions to Reynolds stress are very
intermittent. In Section 3.5 CP' Deasure of thd inmittency is discussed. The
probability density distribution af the uu s w l was a h determined with the
computer. Figure 9
as a function of uo/ii?j, where /3
, d(uu) is
the probability that uu lies between wu and uv + d(uo). Note that the distribution has a large tail for uu/ao > 1 ( i e , uu < 0 since t@ < 0). This again
indicates that large negative values of uu occur Occasionally.
' extremely large contributionr to ReynaMs stress occasionally occur.