

REYNOLDS STRESS STRUCTURE IN TURBULENT BOUNDARY LAYER 295
3.3. Concectwn and Scale of Burst and Sweep Patterns near the Wall
Using these detection criteria we were abk to study the convection of
bursts and sweeps by measuring the sorted contributions to Reynolds stress
at various distances downstream of the u, wire used for detection. The
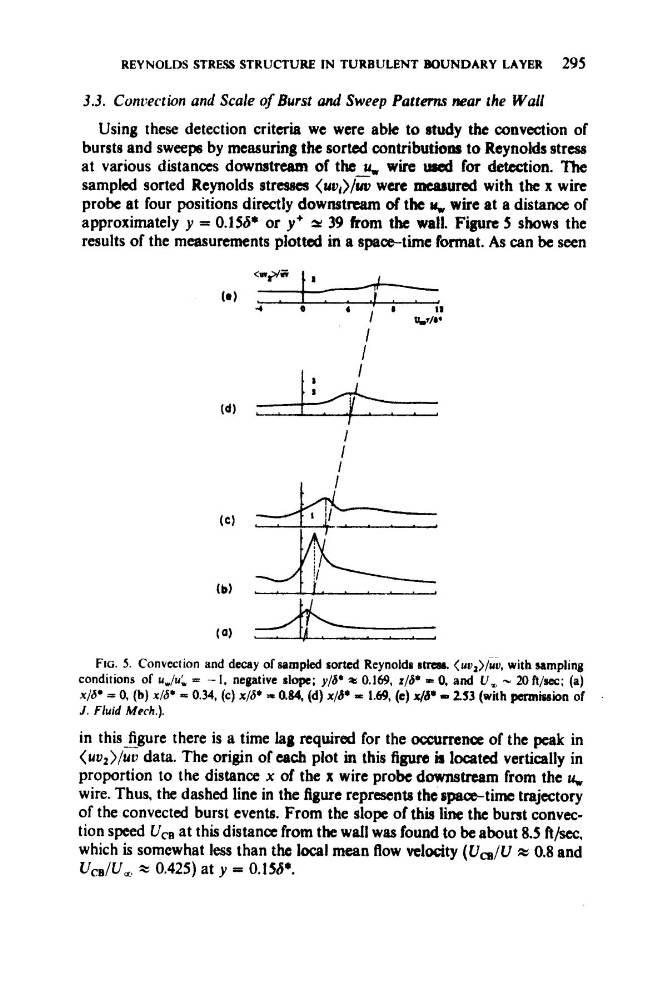
sampled sorted Reynolds stresses (uo,)/& were measured with the x wire
probe at four positions directly downstream o f the w, wire at a distance of
approximately y = 0.156* or y+ = 39 from the wall. Figure 5 shows the
results of the measurements plotted in a space-time brmat. As can be seen
I
1
I
FIG. 5. Convcction and d a y of sampled sorted Reynolds s t r a ~ . (uo,)/uu, with aampling
conditions of u,/u6. = -I. negative slope; y / P z 0.169, z / P = 0, and U, - 20h/sac; (a)
x/d* = 0, (b) XIS* = 0.34, (c) x/&* = 0.84, (d) x/d* = 1.69, (e) 4P = 2 3 3 (with pcrmhion of
J . Fluid Mech.).
in this figure there is a time lag required for the occurrence of the peak in
< u v , ) / ~ data. The origin of each plot in this figwle L located vertically in
proportion to the distance x of the x wire probe downstream from the u,
wire. Thus, the dashed line in the figure represcnta the opaae-time trajectory
of the convected burst events. From the slope of this line the burst convection speed Wce at this distance from the wall was found to be about 8.5 ft/sec,
which is somewhat less than the local mean flow velacity (U,/U z 0.8 and
Uca/U, 2 0.425) at y = 0.156+.
3.3. Concectwn and Scale of Burst and Sweep Patterns near the Wall
Using these detection criteria we were abk to study the convection of
bursts and sweeps by measuring the sorted contributions to Reynolds stress
at various distances downstream of the u, wire used for detection. The
sampled sorted Reynolds stresses (uo,)/& were measured with the x wire
probe at four positions directly downstream o f the w, wire at a distance of
approximately y = 0.156* or y+ = 39 from the wall. Figure 5 shows the
results of the measurements plotted in a space-time brmat. As can be seen
I
1
I
FIG. 5. Convcction and d a y of sampled sorted Reynolds s t r a ~ . (uo,)/uu, with aampling
conditions of u,/u6. = -I. negative slope; y / P z 0.169, z / P = 0, and U, - 20h/sac; (a)
x/d* = 0, (b) XIS* = 0.34, (c) x/&* = 0.84, (d) x/d* = 1.69, (e) 4P = 2 3 3 (with pcrmhion of
J . Fluid Mech.).
in this figure there is a time lag required for the occurrence of the peak in
< u v , ) / ~ data. The origin of each plot in this figwle L located vertically in
proportion to the distance x of the x wire probe downstream from the u,
wire. Thus, the dashed line in the figure represcnta the opaae-time trajectory
of the convected burst events. From the slope of this line the burst convection speed Wce at this distance from the wall was found to be about 8.5 ft/sec,
which is somewhat less than the local mean flow velacity (U,/U z 0.8 and
Uca/U, 2 0.425) at y = 0.156+.