

R. A. ANTONIA AND R. E. LUXTON
- 20
- 6
Fw- lo
- 3 - 0
I
A
19 3o
t
0
0
A
0
0
0
0
JO
fU.
I
I
1
J
1.0
2.0
3.0
r / d ,
A, F W w .
x/h, = 1.42; 0, F,; 0, F,;A, F .",.
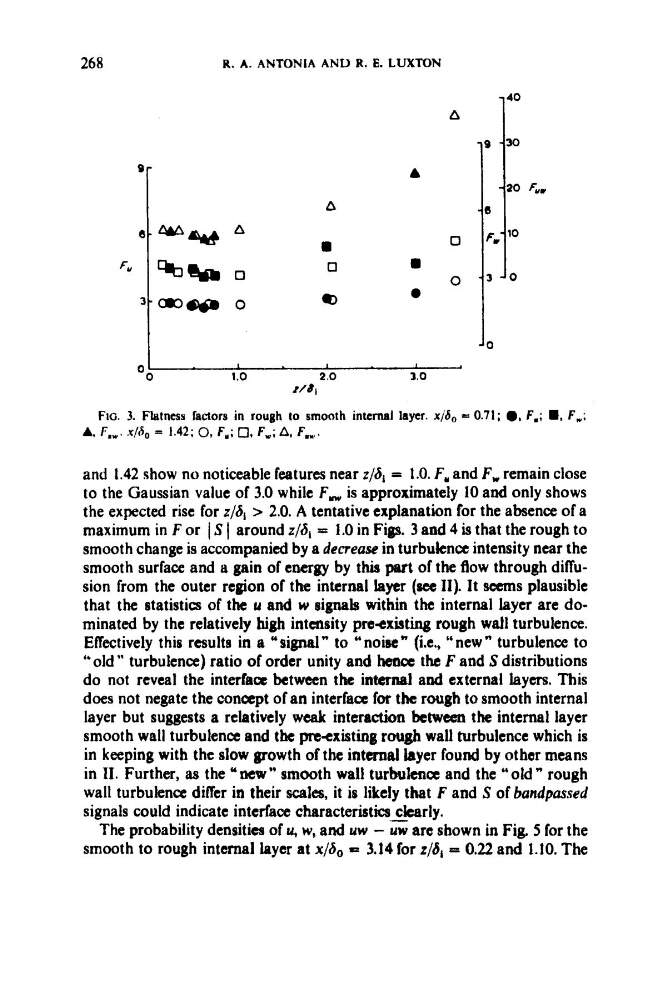
FIG. 3. Flatness factors in rough to smooth internal layer. x/S, = 0.71; 0 , F,; .. F w ;
and 1.42 show no noticeable features near z/6, = 1.0. F, and F , remain close
to the Gaussian value of 3.0 while F , is approximately 10 and only shows
the expected rise for z/6, > 2.0. A tentative explanation for the absence of a
maximum in F or I S 1 around z/S, = 1.0 in Figs. 3 and 4 is that the rough to
smooth change is accompanied by a decrease in turbukncc intensity near the
smooth surface and a gain of energy by this part of the flow through diffusion from the outer region of the internal layer (see 11). It seems plausible
that the statistics of the u and w signals within the internal layer are dominated by the relatively high intensity procxhting rough wall turbulence.
Effectively this results in a usignal" to "noise" (i.e., "new" turbulence to
"old " turbulence) ratio of order unity and hence the F and S distributions
do not reveal the interface between the internal and external layers. This
does not negate the concept of an interface for the rough to smooth internal
layer but suggests a relatively weak interadion between the internal layer
smooth wall turbulence and the preexisting rough wall turbulence which is
in keeping with the slow growth of the internal hyer found by other means
in 11. Further, as the "new" smooth wall turbulence and the "old " rough
wall turbulence differ in their scales, it is likely that P and S of bandpassed
signals could indicate interface characteristics - clearly.
The probability densitiea of u, w, and uw - uw are shown in Fig. 5 for the
smooth to rough internal layer at x/a0 = 3.14 for z/b, - 0.22 and 1.10. The
- 20
- 6
Fw- lo
- 3 - 0
I
A
19 3o
t
0
0
A
0
0
0
0
JO
fU.
I
I
1
J
1.0
2.0
3.0
r / d ,
A, F W w .
x/h, = 1.42; 0, F,; 0, F,;A, F .",.
FIG. 3. Flatness factors in rough to smooth internal layer. x/S, = 0.71; 0 , F,; .. F w ;
and 1.42 show no noticeable features near z/6, = 1.0. F, and F , remain close
to the Gaussian value of 3.0 while F , is approximately 10 and only shows
the expected rise for z/6, > 2.0. A tentative explanation for the absence of a
maximum in F or I S 1 around z/S, = 1.0 in Figs. 3 and 4 is that the rough to
smooth change is accompanied by a decrease in turbukncc intensity near the
smooth surface and a gain of energy by this part of the flow through diffusion from the outer region of the internal layer (see 11). It seems plausible
that the statistics of the u and w signals within the internal layer are dominated by the relatively high intensity procxhting rough wall turbulence.
Effectively this results in a usignal" to "noise" (i.e., "new" turbulence to
"old " turbulence) ratio of order unity and hence the F and S distributions
do not reveal the interface between the internal and external layers. This
does not negate the concept of an interface for the rough to smooth internal
layer but suggests a relatively weak interadion between the internal layer
smooth wall turbulence and the preexisting rough wall turbulence which is
in keeping with the slow growth of the internal hyer found by other means
in 11. Further, as the "new" smooth wall turbulence and the "old " rough
wall turbulence differ in their scales, it is likely that P and S of bandpassed
signals could indicate interface characteristics - clearly.
The probability densitiea of u, w, and uw - uw are shown in Fig. 5 for the
smooth to rough internal layer at x/a0 = 3.14 for z/b, - 0.22 and 1.10. The