

VELOCITY AND 1 FNGTH SCAl ES
22 I
bar denotes an ensemble average. It IS expected that B(r’, r ; ) should have
positive values and decrease in a regular way between the initial value of I
and final value of 0. If for example the value of r’ found after one time
interval Sr was entirely unrelated to the initial value of r‘,, then B(6t; r ; ) = 0
as r’(&) = A. A persistence time scale T‘ is defined using the function
B ( t ; r’,) as
T = I B / dr’.
The value of 7 is interpreted as the equivalent time interval before which
r‘(t’) = r’(0) and after which r’(r’) = A.
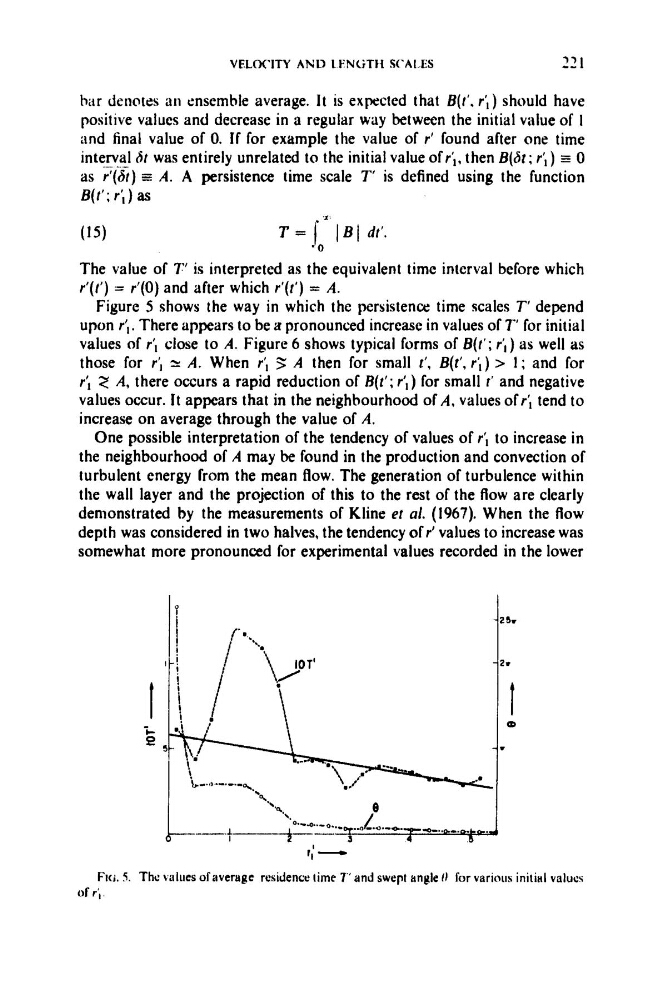
Figure 5 shows the way in which the persistence time scales T‘ depend
upon r’,. There appears to be a pronounced increase in values of T’ for initial
values of r; close to A. Figure 6 shows typical forms of B(t’; r’,) as well as
those for r’, * A. When r’, A then for small r‘, B(t’, r’,) > 1; and for
r’, 2 A, there occurs a rapid reduction of R(t’; r ; ) for small f ‘ and negative
values occur. It appears that in the neighhourhood of A, values of r‘, tend to
increase on average through the value of A.
One possible interpretation of the tendency of values of r‘, to increase in
the neighbourhood of A may be found in the production and convection of
turbulent energy from the mean flow. The generation of turbulence within
the wall layer and the projection of this to the rest of the flow are clearly
demonstrated by the measurements of Kline et a/. (1967). When the flow
depth was considered in two halves, the tendency of r’ values to increase was
somewhat more pronounced for experimental values recorded in the lower
‘ 0
(15)
Flu. 5. The values of ilVertlgC residence lime 7‘ and swept angle 0 for various initial valucs
of r’,
22 I
bar denotes an ensemble average. It IS expected that B(r’, r ; ) should have
positive values and decrease in a regular way between the initial value of I
and final value of 0. If for example the value of r’ found after one time
interval Sr was entirely unrelated to the initial value of r‘,, then B(6t; r ; ) = 0
as r’(&) = A. A persistence time scale T‘ is defined using the function
B ( t ; r’,) as
T = I B / dr’.
The value of 7 is interpreted as the equivalent time interval before which
r‘(t’) = r’(0) and after which r’(r’) = A.
Figure 5 shows the way in which the persistence time scales T‘ depend
upon r’,. There appears to be a pronounced increase in values of T’ for initial
values of r; close to A. Figure 6 shows typical forms of B(t’; r’,) as well as
those for r’, * A. When r’, A then for small r‘, B(t’, r’,) > 1; and for
r’, 2 A, there occurs a rapid reduction of R(t’; r ; ) for small f ‘ and negative
values occur. It appears that in the neighhourhood of A, values of r‘, tend to
increase on average through the value of A.
One possible interpretation of the tendency of values of r‘, to increase in
the neighbourhood of A may be found in the production and convection of
turbulent energy from the mean flow. The generation of turbulence within
the wall layer and the projection of this to the rest of the flow are clearly
demonstrated by the measurements of Kline et a/. (1967). When the flow
depth was considered in two halves, the tendency of r’ values to increase was
somewhat more pronounced for experimental values recorded in the lower
‘ 0
(15)
Flu. 5. The values of ilVertlgC residence lime 7‘ and swept angle 0 for various initial valucs
of r’,