

I so
RlCtlARI) 1.. PESKllri
DI STA NC E
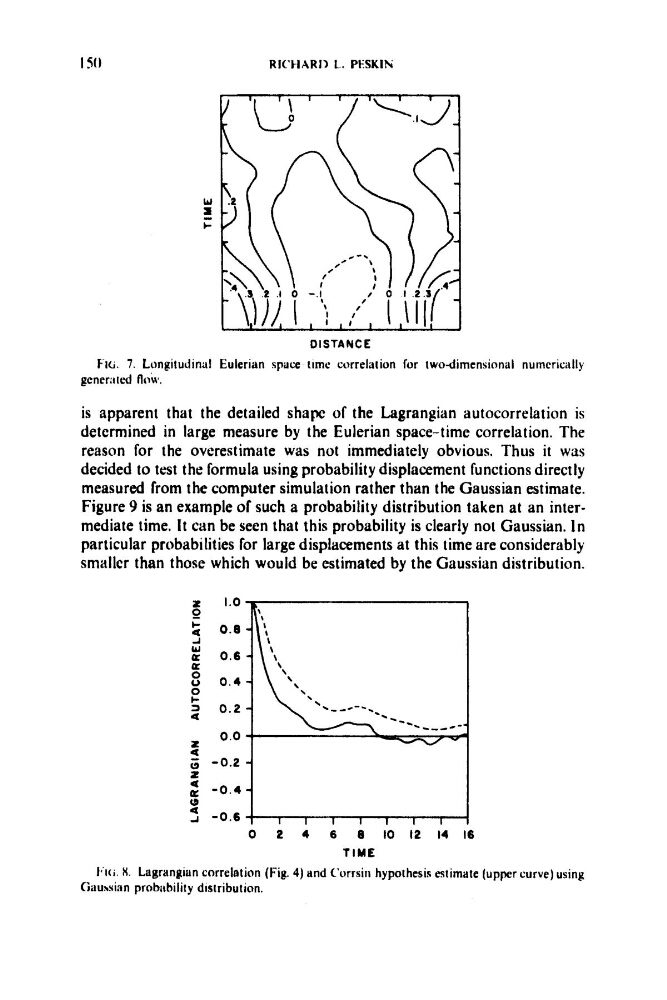
F-IG. 7. Longitudinal Eulerian space time correlation for two-dimensional numerically
gcnerirted flow,.
is apparent that the detailed shape of the Lagrangian autocorrelation is
determined in large measure by the Eulerian space-time correlation. The
reason for the overestimate was not immediately obvious. Thus it was
decided to test the formula using probability displacement functions directly
measured from the computer simulation rather than the Gaussian estimate.
Figure 9 is an example of such a probability distribution taken at an intermediate time. It can be seen that this probability is clearly not Gaussian. In
particular probabilities for large displacements at this time are considerably
smallcr than those which would be estimated by the Gaussian distribution.
2
1.0
0
2 0 . 8
-I
w
a 0 . 6
a
00 0 . 4
0
k
3
0 . 2
a
0 . 0
a
3 -0.2
2
t
2 - 0 . 4
0
- I - 0 . 6
a
0
t! 4 6 8 1 0 I 2 14 16
T I M E
t i ( ; . H. Lagrangiun correlation (Fig. 4) and Corrsin hypothesis estimate (uppr curve) using
Gauwi:in probithilily distribution.
RlCtlARI) 1.. PESKllri
DI STA NC E
F-IG. 7. Longitudinal Eulerian space time correlation for two-dimensional numerically
gcnerirted flow,.
is apparent that the detailed shape of the Lagrangian autocorrelation is
determined in large measure by the Eulerian space-time correlation. The
reason for the overestimate was not immediately obvious. Thus it was
decided to test the formula using probability displacement functions directly
measured from the computer simulation rather than the Gaussian estimate.
Figure 9 is an example of such a probability distribution taken at an intermediate time. It can be seen that this probability is clearly not Gaussian. In
particular probabilities for large displacements at this time are considerably
smallcr than those which would be estimated by the Gaussian distribution.
2
1.0
0
2 0 . 8
-I
w
a 0 . 6
a
00 0 . 4
0
k
3
0 . 2
a
0 . 0
a
3 -0.2
2
t
2 - 0 . 4
0
- I - 0 . 6
a
0
t! 4 6 8 1 0 I 2 14 16
T I M E
t i ( ; . H. Lagrangiun correlation (Fig. 4) and Corrsin hypothesis estimate (uppr curve) using
Gauwi:in probithilily distribution.