

NIJMERICAL SlMULATlON OF LAGKAhCiIAN QUANTITIES
145
etc. (Fox, 1972), but these subjects are heyoid the scope of this paper. The
following equations describe the predicted spectrum according to Batchelor
and Kraichnan:
( r(dE//dt)2/3k - 5 ’ 3 ,
k , < k < k ,
(2.7)
E ( k ) =-I p p k - 3, k, < k < k d
l ,
E = i ~ ( k ) d k
“ 0
q is the mean square vorticity rate. k, = k,(r) is the low wave number limit,
k, is the energy input wave number, and k d is the dissipation wave number.
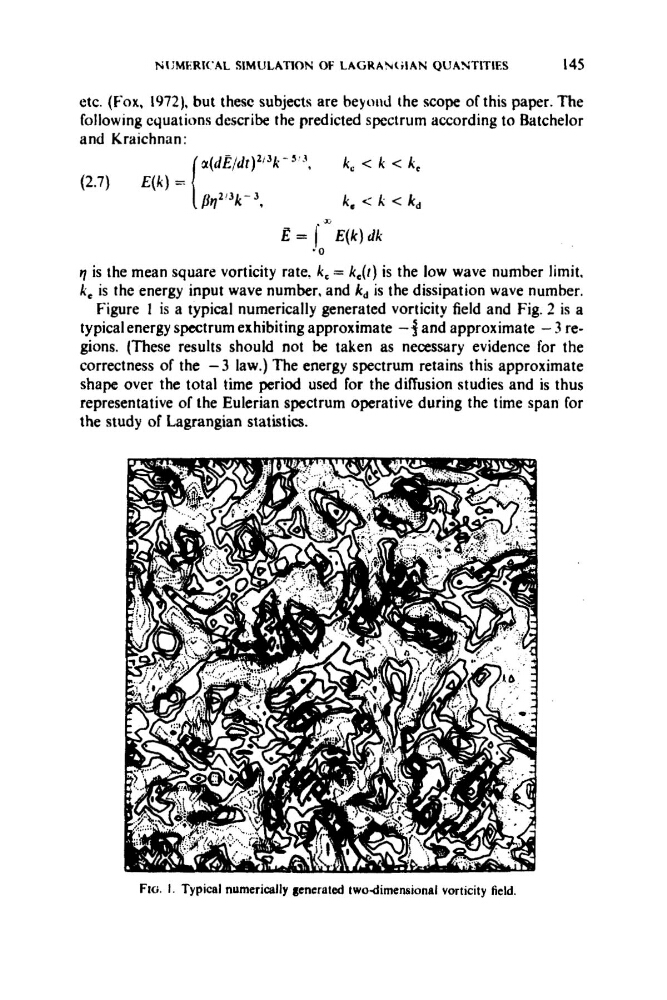
Figure 1 is a typical numerically generated vorticity field and Fig. 2 is a
typical energy spectrum exhibiting approximate -3 and approximate - 3 regions. (These results should not be taken as necessary evidence for the
correctness of the - 3 law.) The energy spectrum retains this approximate
shape over the total time period used for the diffusion studies and is thus
representative of the Eulerian spectrum operative during the time span for
the study of Lagrangian statistics.
FIG. I. Typical numerically generated twodimensional vorticity field.
145
etc. (Fox, 1972), but these subjects are heyoid the scope of this paper. The
following equations describe the predicted spectrum according to Batchelor
and Kraichnan:
( r(dE//dt)2/3k - 5 ’ 3 ,
k , < k < k ,
(2.7)
E ( k ) =-I p p k - 3, k, < k < k d
l ,
E = i ~ ( k ) d k
“ 0
q is the mean square vorticity rate. k, = k,(r) is the low wave number limit,
k, is the energy input wave number, and k d is the dissipation wave number.
Figure 1 is a typical numerically generated vorticity field and Fig. 2 is a
typical energy spectrum exhibiting approximate -3 and approximate - 3 regions. (These results should not be taken as necessary evidence for the
correctness of the - 3 law.) The energy spectrum retains this approximate
shape over the total time period used for the diffusion studies and is thus
representative of the Eulerian spectrum operative during the time span for
the study of Lagrangian statistics.
FIG. I. Typical numerically generated twodimensional vorticity field.