

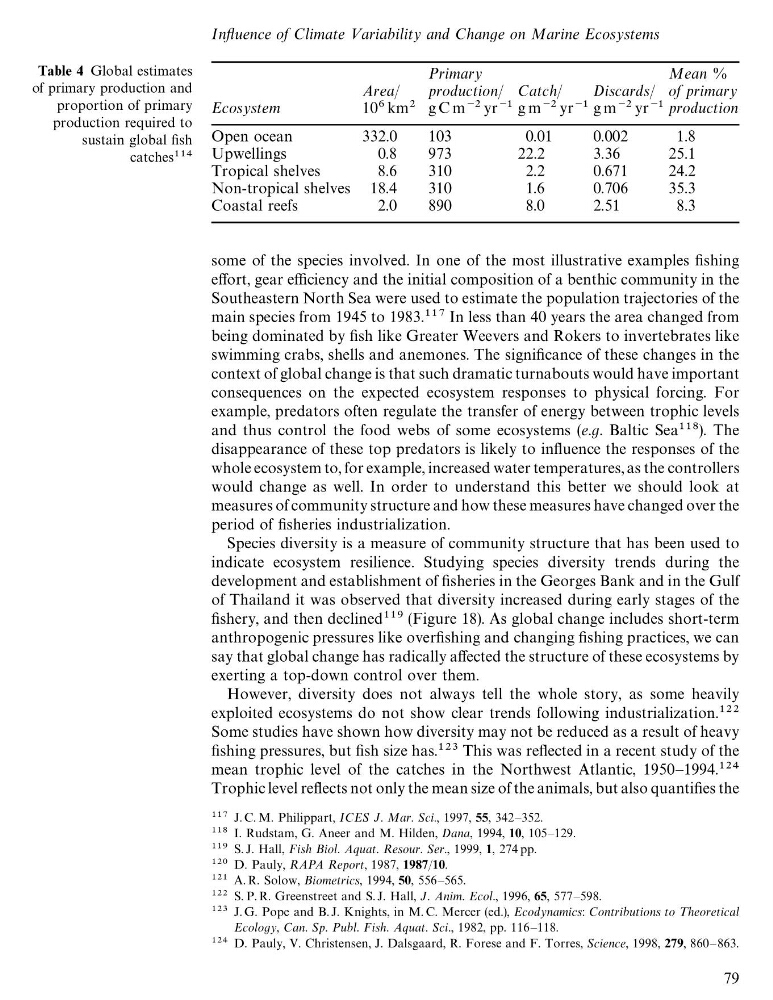
Table 4 Global estimates
of primary production and
proportion of primary
production required to
sustain global fish
catches
Primary
Mean %
Area/
production/ Catch/
Discards/ of primary
Ecosystem
10 km g C m\ yr\ g m\ yr\ g m\ yr\ production
Open ocean
332.0
103
0.01
0.002
1.8
Upwellings
0.8
973
22.2
3.36
25.1
Tropical shelves
8.6
310
2.2
0.671
24.2
Non-tropical shelves 18.4
310
1.6
0.706
35.3
Coastal reefs
2.0
890
8.0
2.51
8.3
some of the species involved. In one of the most illustrative examples fishing
effort, gear efficiency and the initial composition of a benthic community in the
Southeastern North Sea were used to estimate the population trajectories of the
main species from 1945 to 1983. In less than 40 years the area changed from
being dominated by fish like Greater Weevers and Rokers to invertebrates like
swimming crabs, shells and anemones. The significance of these changes in the
context of global change is that such dramatic turnabouts would have important
consequences on the expected ecosystem responses to physical forcing. For
example, predators often regulate the transfer of energy between trophic levels
and thus control the food webs of some ecosystems (e.g. Baltic Sea). The
disappearance of these top predators is likely to influence the responses of the
whole ecosystem to, for example, increased water temperatures, as the controllers
would change as well. In order to understand this better we should look at
measures of community structure and how these measures have changed over the
period of fisheries industrialization.
Species diversity is a measure of community structure that has been used to
indicate ecosystem resilience. Studying species diversity trends during the
development and establishment of fisheries in the Georges Bank and in the Gulf
of Thailand it was observed that diversity increased during early stages of the
fishery, and then declined (Figure 18). As global change includes short-term
anthropogenic pressures like overfishing and changing fishing practices, we can
say that global change has radically affected the structure of these ecosystems by
exerting a top-down control over them.
However, diversity does not always tell the whole story, as some heavily
exploited ecosystems do not show clear trends following industrialization.
Some studies have shown how diversity may not be reduced as a result of heavy
fishing pressures, but fish size has. This was reflected in a recent study of the
mean trophic level of the catches in the Northwest Atlantic, 1950—1994.
Trophic level reflects not only the mean size of the animals, but also quantifies the
J. C. M. Philippart, ICES J. Mar. Sci., 1997, 55, 342—352.
I. Rudstam, G. Aneer and M. Hilden, Dana, 1994, 10, 105—129.
S. J. Hall, Fish Biol. Aquat. Resour. Ser., 1999, 1, 274 pp.
D. Pauly, RAPA Report, 1987, 1987/10.
A. R. Solow, Biometrics, 1994, 50, 556—565.
S. P. R. Greenstreet and S. J. Hall, J. Anim. Ecol., 1996, 65, 577—598.
J. G. Pope and B. J. Knights, in M. C. Mercer (ed.), Ecodynamics: Contributions to Theoretical
Ecology, Can. Sp. Publ. Fish. Aquat. Sci., 1982, pp. 116—118.
D. Pauly, V. Christensen, J. Dalsgaard, R. Forese and F. Torres, Science, 1998, 279, 860—863.
Influence of Climate Variability and Change on Marine Ecosystems
79
of primary production and
proportion of primary
production required to
sustain global fish
catches
Primary
Mean %
Area/
production/ Catch/
Discards/ of primary
Ecosystem
10 km g C m\ yr\ g m\ yr\ g m\ yr\ production
Open ocean
332.0
103
0.01
0.002
1.8
Upwellings
0.8
973
22.2
3.36
25.1
Tropical shelves
8.6
310
2.2
0.671
24.2
Non-tropical shelves 18.4
310
1.6
0.706
35.3
Coastal reefs
2.0
890
8.0
2.51
8.3
some of the species involved. In one of the most illustrative examples fishing
effort, gear efficiency and the initial composition of a benthic community in the
Southeastern North Sea were used to estimate the population trajectories of the
main species from 1945 to 1983. In less than 40 years the area changed from
being dominated by fish like Greater Weevers and Rokers to invertebrates like
swimming crabs, shells and anemones. The significance of these changes in the
context of global change is that such dramatic turnabouts would have important
consequences on the expected ecosystem responses to physical forcing. For
example, predators often regulate the transfer of energy between trophic levels
and thus control the food webs of some ecosystems (e.g. Baltic Sea). The
disappearance of these top predators is likely to influence the responses of the
whole ecosystem to, for example, increased water temperatures, as the controllers
would change as well. In order to understand this better we should look at
measures of community structure and how these measures have changed over the
period of fisheries industrialization.
Species diversity is a measure of community structure that has been used to
indicate ecosystem resilience. Studying species diversity trends during the
development and establishment of fisheries in the Georges Bank and in the Gulf
of Thailand it was observed that diversity increased during early stages of the
fishery, and then declined (Figure 18). As global change includes short-term
anthropogenic pressures like overfishing and changing fishing practices, we can
say that global change has radically affected the structure of these ecosystems by
exerting a top-down control over them.
However, diversity does not always tell the whole story, as some heavily
exploited ecosystems do not show clear trends following industrialization.
Some studies have shown how diversity may not be reduced as a result of heavy
fishing pressures, but fish size has. This was reflected in a recent study of the
mean trophic level of the catches in the Northwest Atlantic, 1950—1994.
Trophic level reflects not only the mean size of the animals, but also quantifies the
J. C. M. Philippart, ICES J. Mar. Sci., 1997, 55, 342—352.
I. Rudstam, G. Aneer and M. Hilden, Dana, 1994, 10, 105—129.
S. J. Hall, Fish Biol. Aquat. Resour. Ser., 1999, 1, 274 pp.
D. Pauly, RAPA Report, 1987, 1987/10.
A. R. Solow, Biometrics, 1994, 50, 556—565.
S. P. R. Greenstreet and S. J. Hall, J. Anim. Ecol., 1996, 65, 577—598.
J. G. Pope and B. J. Knights, in M. C. Mercer (ed.), Ecodynamics: Contributions to Theoretical
Ecology, Can. Sp. Publ. Fish. Aquat. Sci., 1982, pp. 116—118.
D. Pauly, V. Christensen, J. Dalsgaard, R. Forese and F. Torres, Science, 1998, 279, 860—863.
Influence of Climate Variability and Change on Marine Ecosystems
79