

-5
0
5
10
15
20
25
30
35
2020s
2050s
2080s
Timeslice
% Change in Cereal Prices due to Climate Change
HadCM3
HadCM2GGax Range
-140
-120
-100
-80
-60
-40
-20
0
2020
2050
2080
Timeslice
Change in Cereal Production /Mt
HadCM3
HadCM2GGax Rang e
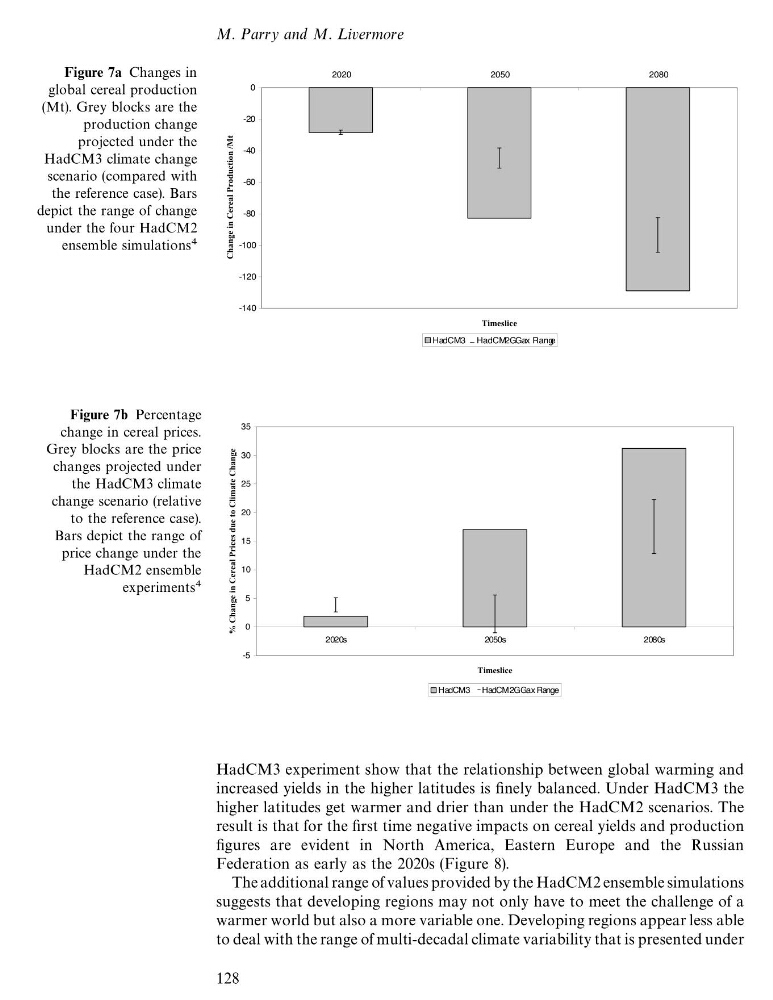
Figure 7a Changes in
global cereal production
(Mt). Grey blocks are the
production change
projected under the
HadCM3 climate change
scenario (compared with
the reference case). Bars
depict the range of change
under the four HadCM2
ensemble simulations
Figure 7b Percentage
change in cereal prices.
Grey blocks are the price
changes projected under
the HadCM3 climate
change scenario (relative
to the reference case).
Bars depict the range of
price change under the
HadCM2 ensemble
experiments
HadCM3 experiment show that the relationship between global warming and
increased yields in the higher latitudes is finely balanced. Under HadCM3 the
higher latitudes get warmer and drier than under the HadCM2 scenarios. The
result is that for the first time negative impacts on cereal yields and production
figures are evident in North America, Eastern Europe and the Russian
Federation as early as the 2020s (Figure 8).
The additional range of values provided by the HadCM2 ensemble simulations
suggests that developing regions may not only have to meet the challenge of a
warmer world but also a more variable one. Developing regions appear less able
to deal with the range of multi-decadal climate variability that is presented under
M. Parry and M. Livermore
128
0
5
10
15
20
25
30
35
2020s
2050s
2080s
Timeslice
% Change in Cereal Prices due to Climate Change
HadCM3
HadCM2GGax Range
-140
-120
-100
-80
-60
-40
-20
0
2020
2050
2080
Timeslice
Change in Cereal Production /Mt
HadCM3
HadCM2GGax Rang e
Figure 7a Changes in
global cereal production
(Mt). Grey blocks are the
production change
projected under the
HadCM3 climate change
scenario (compared with
the reference case). Bars
depict the range of change
under the four HadCM2
ensemble simulations
Figure 7b Percentage
change in cereal prices.
Grey blocks are the price
changes projected under
the HadCM3 climate
change scenario (relative
to the reference case).
Bars depict the range of
price change under the
HadCM2 ensemble
experiments
HadCM3 experiment show that the relationship between global warming and
increased yields in the higher latitudes is finely balanced. Under HadCM3 the
higher latitudes get warmer and drier than under the HadCM2 scenarios. The
result is that for the first time negative impacts on cereal yields and production
figures are evident in North America, Eastern Europe and the Russian
Federation as early as the 2020s (Figure 8).
The additional range of values provided by the HadCM2 ensemble simulations
suggests that developing regions may not only have to meet the challenge of a
warmer world but also a more variable one. Developing regions appear less able
to deal with the range of multi-decadal climate variability that is presented under
M. Parry and M. Livermore
128