

529
Topographic Maps
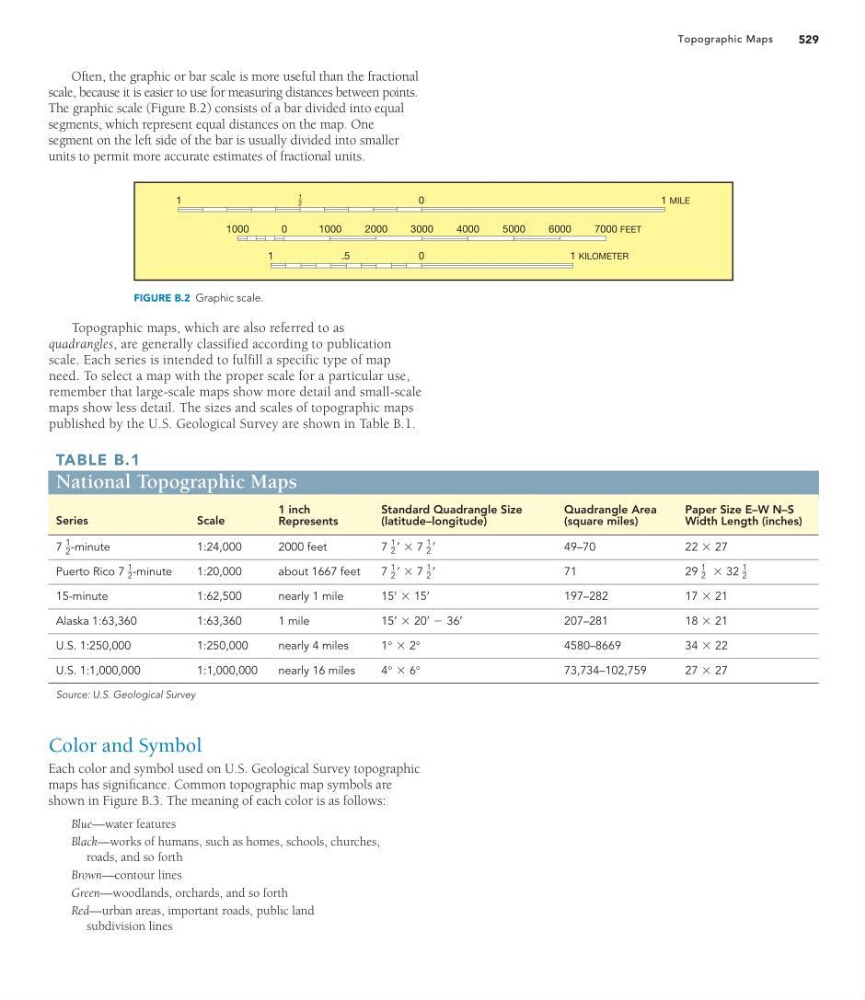
Often, the graphic or bar scale is more useful than the fractional
scale, because it is easier to use for measuring distances between points.
The graphic scale (Figure B.2) consists of a bar divided into equal
segments, which represent equal distances on the map. One
segment on the left side of the bar is usually divided into smaller
units to permit more accurate estimates of fractional units.
TABLE B.1
National Topographic Maps
Series
Scale
1 inch
Represents
Standard Quadrangle Size
(latitude–longitude)
Quadrangle Area
(square miles)
Paper Size E–W N–S
Width Length (inches)
-minute
7
1
2
1:24,000
2000 feet
7
1
2
œ * 7
1
2
œ
49–70
22 * 27
Puerto Rico
-minute
7
1
2
1:20,000
about 1667 feet
7
1
2
œ * 7
1
2
œ
71
29
1
2 * 32
1
2
15-minute
1:62,500
nearly 1 mile
15
œ * 15
œ
197–282
17 * 21
Alaska 1:63,360
1:63,360
1 mile
15
œ * 20
œ - 36
œ
207–281
18 * 21
U.S. 1:250,000
1:250,000
nearly 4 miles
1° * 2°
4580–8669
34 * 22
U.S. 1:1,000,000
1:1,000,000
nearly 16 miles
4° * 6°
73,734–102,759
27 * 27
Source: U.S. Geological Survey
1
1
2
0
1 MILE
0
2000
1000
1000
0
4000
3000
5000
6000
7000 FEET
1 KILOMETER
.5
1
FIGURE B.2 Graphic scale.
Color and Symbol
Each color and symbol used on U.S. Geological Survey topographic
maps has significance. Common topographic map symbols are
shown in Figure B.3. The meaning of each color is as follows:
Blue—water features
Black—works of humans, such as homes, schools, churches,
roads, and so forth
Brown—contour lines
Green—woodlands, orchards, and so forth
Red—urban areas, important roads, public land
subdivision lines
Topographic maps, which are also referred to as
quadrangles, are generally classified according to publication
scale. Each series is intended to fulfill a specific type of map
need. To select a map with the proper scale for a particular use,
remember that large-scale maps show more detail and small-scale
maps show less detail. The sizes and scales of topographic maps
published by the U.S. Geological Survey are shown in Table B.1.
Topographic Maps
Often, the graphic or bar scale is more useful than the fractional
scale, because it is easier to use for measuring distances between points.
The graphic scale (Figure B.2) consists of a bar divided into equal
segments, which represent equal distances on the map. One
segment on the left side of the bar is usually divided into smaller
units to permit more accurate estimates of fractional units.
TABLE B.1
National Topographic Maps
Series
Scale
1 inch
Represents
Standard Quadrangle Size
(latitude–longitude)
Quadrangle Area
(square miles)
Paper Size E–W N–S
Width Length (inches)
-minute
7
1
2
1:24,000
2000 feet
7
1
2
œ * 7
1
2
œ
49–70
22 * 27
Puerto Rico
-minute
7
1
2
1:20,000
about 1667 feet
7
1
2
œ * 7
1
2
œ
71
29
1
2 * 32
1
2
15-minute
1:62,500
nearly 1 mile
15
œ * 15
œ
197–282
17 * 21
Alaska 1:63,360
1:63,360
1 mile
15
œ * 20
œ - 36
œ
207–281
18 * 21
U.S. 1:250,000
1:250,000
nearly 4 miles
1° * 2°
4580–8669
34 * 22
U.S. 1:1,000,000
1:1,000,000
nearly 16 miles
4° * 6°
73,734–102,759
27 * 27
Source: U.S. Geological Survey
1
1
2
0
1 MILE
0
2000
1000
1000
0
4000
3000
5000
6000
7000 FEET
1 KILOMETER
.5
1
FIGURE B.2 Graphic scale.
Color and Symbol
Each color and symbol used on U.S. Geological Survey topographic
maps has significance. Common topographic map symbols are
shown in Figure B.3. The meaning of each color is as follows:
Blue—water features
Black—works of humans, such as homes, schools, churches,
roads, and so forth
Brown—contour lines
Green—woodlands, orchards, and so forth
Red—urban areas, important roads, public land
subdivision lines
Topographic maps, which are also referred to as
quadrangles, are generally classified according to publication
scale. Each series is intended to fulfill a specific type of map
need. To select a map with the proper scale for a particular use,
remember that large-scale maps show more detail and small-scale
maps show less detail. The sizes and scales of topographic maps
published by the U.S. Geological Survey are shown in Table B.1.