

CHAPTER 20 Global Climate Change
508
probable source was volcanic activity.
Carbon dioxide is one of the gases emitted
during volcanism, and there is now
considerable geologic evidence that the
Middle Cretaceous was a time when there
was an unusually high rate of volcanic
activity. Several huge oceanic lava plateaus
were produced on the floor of the western
Pacific during this span. These vast features
were associated with hot spots that may
have been the product of large mantle
plumes. Massive outpourings of lava over
millions of years would have been
accompanied by the release of huge
quantities of CO 2 which in turn would
have enhanced the atmospheric greenhouse
effect. Thus, the warmth that characterized
the Cretaceous may have had its origins
deep in Earth’s mantle.
Solar Variability
and Climate
Among the most persistent hypotheses of
climate change have been those based on
the idea that the Sun is a variable star and
that its output of energy varies over time.
The effect of such changes would seem
direct and easily understood: Increases in
solar output would cause the atmosphere
to warm, and reductions would result in
cooling. This notion is appealing because it
can be used to explain climate change of
any length or intensity. However, no major
long-term variations in the total intensity of
solar radiation have yet been measured
outside the atmosphere. Such measurements were not even possible until satellite technology became available. Now that it is possible, we will need many years of records before we begin to sense how variable (or invariable) energy from the Sun really is.
Several proposals for climate change, based on a variable Sun, relate to sunspot cycles.
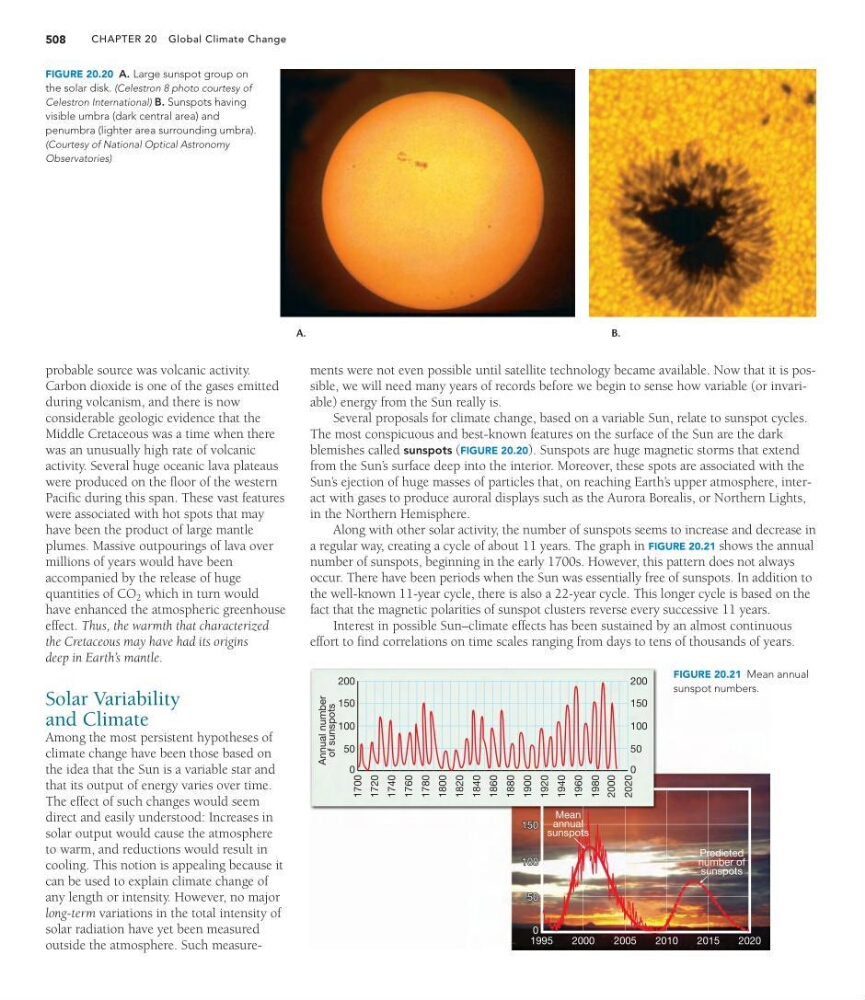
The most conspicuous and best-known features on the surface of the Sun are the dark
blemishes called sunspots (FIGURE 20.20). Sunspots are huge magnetic storms that extend
from the Sun’ s surface deep into the interior. Moreover, these spots are associated with the
Sun’ s ejection of huge masses of particles that, on reaching Earth’ s upper atmosphere, interact with gases to produce auroral displays such as the Aurora Borealis, or Northern Lights,
in the Northern Hemisphere.
Along with other solar activity, the number of sunspots seems to increase and decrease in
a regular way, creating a cycle of about 11 years. The graph in FIGURE 20.21 shows the annual
number of sunspots, beginning in the early 1700s. However, this pattern does not always
occur. There have been periods when the Sun was essentially free of sunspots. In addition to
the well-known 11-year cycle, there is also a 22-year cycle. This longer cycle is based on the
fact that the magnetic polarities of sunspot clusters reverse every successive 11 years.
Interest in possible Sun–climate effects has been sustained by an almost continuous
effort to find correlations on time scales ranging from days to tens of thousands of years.
Annual number
of sunspots
150 150
100 100
50 50
0
Predicted
number of
sunspots
Mean
annual
sunspots
200
150
100
50
0
1700
1740
1760
1780
1800
1820
1840
1860
1880
1900
1920
1940
1960
1980
2000
2020
1720
200
150
100
50
0
1995
2000
2005
2010
2015
2020
150
100
50
0
FIGURE 20.21 Mean annual
sunspot numbers.
B.
A.
FIGURE 20.20 A. Large sunspot group on
the solar disk. (Celestron 8 photo courtesy of
Celestron International) B. Sunspots having
visible umbra (dark central area) and
penumbra (lighter area surrounding umbra).
(Courtesy of National Optical Astronomy
Observatories)
508
probable source was volcanic activity.
Carbon dioxide is one of the gases emitted
during volcanism, and there is now
considerable geologic evidence that the
Middle Cretaceous was a time when there
was an unusually high rate of volcanic
activity. Several huge oceanic lava plateaus
were produced on the floor of the western
Pacific during this span. These vast features
were associated with hot spots that may
have been the product of large mantle
plumes. Massive outpourings of lava over
millions of years would have been
accompanied by the release of huge
quantities of CO 2 which in turn would
have enhanced the atmospheric greenhouse
effect. Thus, the warmth that characterized
the Cretaceous may have had its origins
deep in Earth’s mantle.
Solar Variability
and Climate
Among the most persistent hypotheses of
climate change have been those based on
the idea that the Sun is a variable star and
that its output of energy varies over time.
The effect of such changes would seem
direct and easily understood: Increases in
solar output would cause the atmosphere
to warm, and reductions would result in
cooling. This notion is appealing because it
can be used to explain climate change of
any length or intensity. However, no major
long-term variations in the total intensity of
solar radiation have yet been measured
outside the atmosphere. Such measurements were not even possible until satellite technology became available. Now that it is possible, we will need many years of records before we begin to sense how variable (or invariable) energy from the Sun really is.
Several proposals for climate change, based on a variable Sun, relate to sunspot cycles.
The most conspicuous and best-known features on the surface of the Sun are the dark
blemishes called sunspots (FIGURE 20.20). Sunspots are huge magnetic storms that extend
from the Sun’ s surface deep into the interior. Moreover, these spots are associated with the
Sun’ s ejection of huge masses of particles that, on reaching Earth’ s upper atmosphere, interact with gases to produce auroral displays such as the Aurora Borealis, or Northern Lights,
in the Northern Hemisphere.
Along with other solar activity, the number of sunspots seems to increase and decrease in
a regular way, creating a cycle of about 11 years. The graph in FIGURE 20.21 shows the annual
number of sunspots, beginning in the early 1700s. However, this pattern does not always
occur. There have been periods when the Sun was essentially free of sunspots. In addition to
the well-known 11-year cycle, there is also a 22-year cycle. This longer cycle is based on the
fact that the magnetic polarities of sunspot clusters reverse every successive 11 years.
Interest in possible Sun–climate effects has been sustained by an almost continuous
effort to find correlations on time scales ranging from days to tens of thousands of years.
Annual number
of sunspots
150 150
100 100
50 50
0
Predicted
number of
sunspots
Mean
annual
sunspots
200
150
100
50
0
1700
1740
1760
1780
1800
1820
1840
1860
1880
1900
1920
1940
1960
1980
2000
2020
1720
200
150
100
50
0
1995
2000
2005
2010
2015
2020
150
100
50
0
FIGURE 20.21 Mean annual
sunspot numbers.
B.
A.
FIGURE 20.20 A. Large sunspot group on
the solar disk. (Celestron 8 photo courtesy of
Celestron International) B. Sunspots having
visible umbra (dark central area) and
penumbra (lighter area surrounding umbra).
(Courtesy of National Optical Astronomy
Observatories)