

CHAPTER 16 Origin and Evolution of the Ocean Floor
394
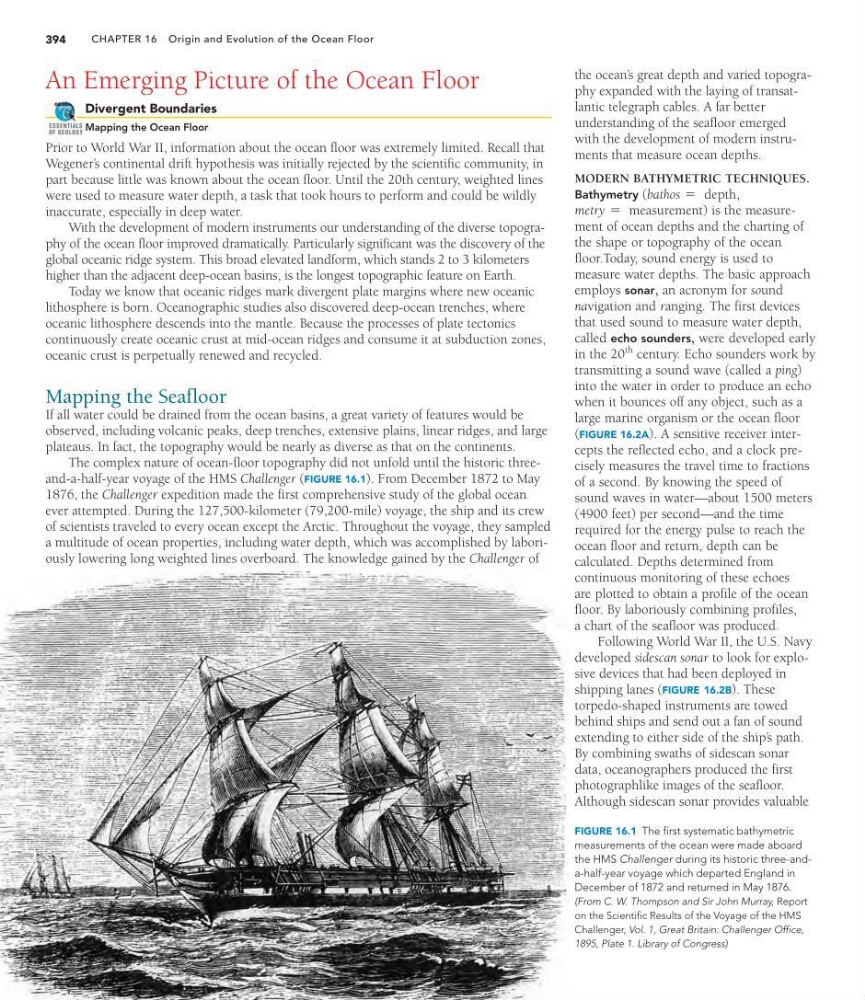
FIGURE 16.1 The first systematic bathymetric
measurements of the ocean were made aboard
the HMS Challenger during its historic three-anda-half-year voyage which departed England in
December of 1872 and returned in May 1876.
(From C. W. Thompson and Sir John Murray, Report
on the Scientific Results of the Voyage of the HMS
Challenger, Vol. 1, Great Britain: Challenger Office,
1895, Plate 1. Library of Congress)
An Emerging Picture of the Ocean Floor
Divergent Boundaries
Mapping the Ocean Floor
Prior to World War II, information about the ocean floor was extremely limited. Recall that
Wegener’ s continental drift hypothesis was initially rejected by the scientific community, in
part because little was known about the ocean floor. Until the 20th century, weighted lines
were used to measure water depth, a task that took hours to perform and could be wildly
inaccurate, especially in deep water.
With the development of modern instruments our understanding of the diverse topography of the ocean floor improved dramatically. Particularly significant was the discovery of the
global oceanic ridge system. This broad elevated landform, which stands 2 to 3 kilometers
higher than the adjacent deep-ocean basins, is the longest topographic feature on Earth.
Today we know that oceanic ridges mark divergent plate margins where new oceanic
lithosphere is born. Oceanographic studies also discovered deep-ocean trenches, where
oceanic lithosphere descends into the mantle. Because the processes of plate tectonics
continuously create oceanic crust at mid-ocean ridges and consume it at subduction zones,
oceanic crust is perpetually renewed and recycled.
Mapping the Seafloor
If all water could be drained from the ocean basins, a great variety of features would be
observed, including volcanic peaks, deep trenches, extensive plains, linear ridges, and large
plateaus. In fact, the topography would be nearly as diverse as that on the continents.
The complex nature of ocean-floor topography did not unfold until the historic threeand-a-half-year voyage of the HMS Challenger (FIGURE 16.1). From December 1872 to May
1876, the Challenger expedition made the first comprehensive study of the global ocean
ever attempted. During the 127,500-kilometer (79,200-mile) voyage, the ship and its crew
of scientists traveled to every ocean except the Arctic. Throughout the voyage, they sampled
a multitude of ocean properties, including water depth, which was accomplished by laboriously lowering long weighted lines overboard. The knowledge gained by the Challenger of
GEODe
ESSENTIALS
OF GEOLOGY
the ocean’ s great depth and varied topography expanded with the laying of transatlantic telegraph cables. A far better
understanding of the seafloor emerged
with the development of modern instruments that measure ocean depths.
MODERN BATHYMETRIC TECHNIQUES.
Bathymetry (
,
) is the measurement of ocean depths and the charting of
the shape or topography of the ocean
floor.Today, sound energy is used to
measure water depths. The basic approach
employs sonar, an acronym for sound
navigation and ranging. The first devices
that used sound to measure water depth,
called echo sounders, were developed early
in the 20
th century. Echo sounders work by
transmitting a sound wave (called a ping)
into the water in order to produce an echo
when it bounces off any object, such as a
large marine organism or the ocean floor
(FIGURE 16.2A). A sensitive receiver intercepts the reflected echo, and a clock precisely measures the travel time to fractions
of a second. By knowing the speed of
sound waves in water—about 1500 meters
(4900 feet) per second—and the time
required for the energy pulse to reach the
ocean floor and return, depth can be
calculated. Depths determined from
continuous monitoring of these echoes
are plotted to obtain a profile of the ocean
floor. By laboriously combining profiles,
a chart of the seafloor was produced.
Following World War II, the U.S. Navy
developed sidescan sonar to look for explosive devices that had been deployed in
shipping lanes (FIGURE 16.2B). These
torpedo-shaped instruments are towed
behind ships and send out a fan of sound
extending to either side of the ship’ s path.
By combining swaths of sidescan sonar
data, oceanographers produced the first
photographlike images of the seafloor.
Although sidescan sonar provides valuable
metry = measurement
bathos = depth
394
FIGURE 16.1 The first systematic bathymetric
measurements of the ocean were made aboard
the HMS Challenger during its historic three-anda-half-year voyage which departed England in
December of 1872 and returned in May 1876.
(From C. W. Thompson and Sir John Murray, Report
on the Scientific Results of the Voyage of the HMS
Challenger, Vol. 1, Great Britain: Challenger Office,
1895, Plate 1. Library of Congress)
An Emerging Picture of the Ocean Floor
Divergent Boundaries
Mapping the Ocean Floor
Prior to World War II, information about the ocean floor was extremely limited. Recall that
Wegener’ s continental drift hypothesis was initially rejected by the scientific community, in
part because little was known about the ocean floor. Until the 20th century, weighted lines
were used to measure water depth, a task that took hours to perform and could be wildly
inaccurate, especially in deep water.
With the development of modern instruments our understanding of the diverse topography of the ocean floor improved dramatically. Particularly significant was the discovery of the
global oceanic ridge system. This broad elevated landform, which stands 2 to 3 kilometers
higher than the adjacent deep-ocean basins, is the longest topographic feature on Earth.
Today we know that oceanic ridges mark divergent plate margins where new oceanic
lithosphere is born. Oceanographic studies also discovered deep-ocean trenches, where
oceanic lithosphere descends into the mantle. Because the processes of plate tectonics
continuously create oceanic crust at mid-ocean ridges and consume it at subduction zones,
oceanic crust is perpetually renewed and recycled.
Mapping the Seafloor
If all water could be drained from the ocean basins, a great variety of features would be
observed, including volcanic peaks, deep trenches, extensive plains, linear ridges, and large
plateaus. In fact, the topography would be nearly as diverse as that on the continents.
The complex nature of ocean-floor topography did not unfold until the historic threeand-a-half-year voyage of the HMS Challenger (FIGURE 16.1). From December 1872 to May
1876, the Challenger expedition made the first comprehensive study of the global ocean
ever attempted. During the 127,500-kilometer (79,200-mile) voyage, the ship and its crew
of scientists traveled to every ocean except the Arctic. Throughout the voyage, they sampled
a multitude of ocean properties, including water depth, which was accomplished by laboriously lowering long weighted lines overboard. The knowledge gained by the Challenger of
GEODe
ESSENTIALS
OF GEOLOGY
the ocean’ s great depth and varied topography expanded with the laying of transatlantic telegraph cables. A far better
understanding of the seafloor emerged
with the development of modern instruments that measure ocean depths.
MODERN BATHYMETRIC TECHNIQUES.
Bathymetry (
,
) is the measurement of ocean depths and the charting of
the shape or topography of the ocean
floor.Today, sound energy is used to
measure water depths. The basic approach
employs sonar, an acronym for sound
navigation and ranging. The first devices
that used sound to measure water depth,
called echo sounders, were developed early
in the 20
th century. Echo sounders work by
transmitting a sound wave (called a ping)
into the water in order to produce an echo
when it bounces off any object, such as a
large marine organism or the ocean floor
(FIGURE 16.2A). A sensitive receiver intercepts the reflected echo, and a clock precisely measures the travel time to fractions
of a second. By knowing the speed of
sound waves in water—about 1500 meters
(4900 feet) per second—and the time
required for the energy pulse to reach the
ocean floor and return, depth can be
calculated. Depths determined from
continuous monitoring of these echoes
are plotted to obtain a profile of the ocean
floor. By laboriously combining profiles,
a chart of the seafloor was produced.
Following World War II, the U.S. Navy
developed sidescan sonar to look for explosive devices that had been deployed in
shipping lanes (FIGURE 16.2B). These
torpedo-shaped instruments are towed
behind ships and send out a fan of sound
extending to either side of the ship’ s path.
By combining swaths of sidescan sonar
data, oceanographers produced the first
photographlike images of the seafloor.
Although sidescan sonar provides valuable
metry = measurement
bathos = depth