

345
Measuring the Size of Earthquakes
RICHTER MAGNITUDE. In 1935 Charles
Richter of the California Institute of Technology developed the first magnitude scale
using seismic records. As shown in
FIGURE 14.14 (top), the Richter scale is
based on the amplitude of the largest seismic wave (P, S, or surface wave) recorded
on a seismogram. Because seismic waves
weaken as the distance between the focus
and the seismograph increases, Richter
developed a method that accounts for
the decrease in wave amplitude with
increasing distance. Theoretically, as long
as equivalent instruments are used, monitoring stations at various locations will
obtain the same Richter magnitude for
each recorded earthquake. In practice,
however, different recording stations often
obtain slightly different Richter magnitudes
for the same earthquake—a consequence
of the variations in rock types through
which the waves travel.
Earthquakes vary enormously in
strength, and great earthquakes produce
wave amplitudes that are thousands of
times larger than those generated by weak
Seismograph record
24 sec.
0 10 20
Time
sec.
30 mm
20
10
Amplitude
23 mm
Distance,
km
S-P,
sec.
Magnitude,
M L
Amplitude,
mm
500
400
300
200
100
60
40
20
0.5
50
40
30
20
10
8
6
4
2
6
5
4
3
2
1
0
100
50
20
10
5
2
1
0.5
1.2
0.1
P
S
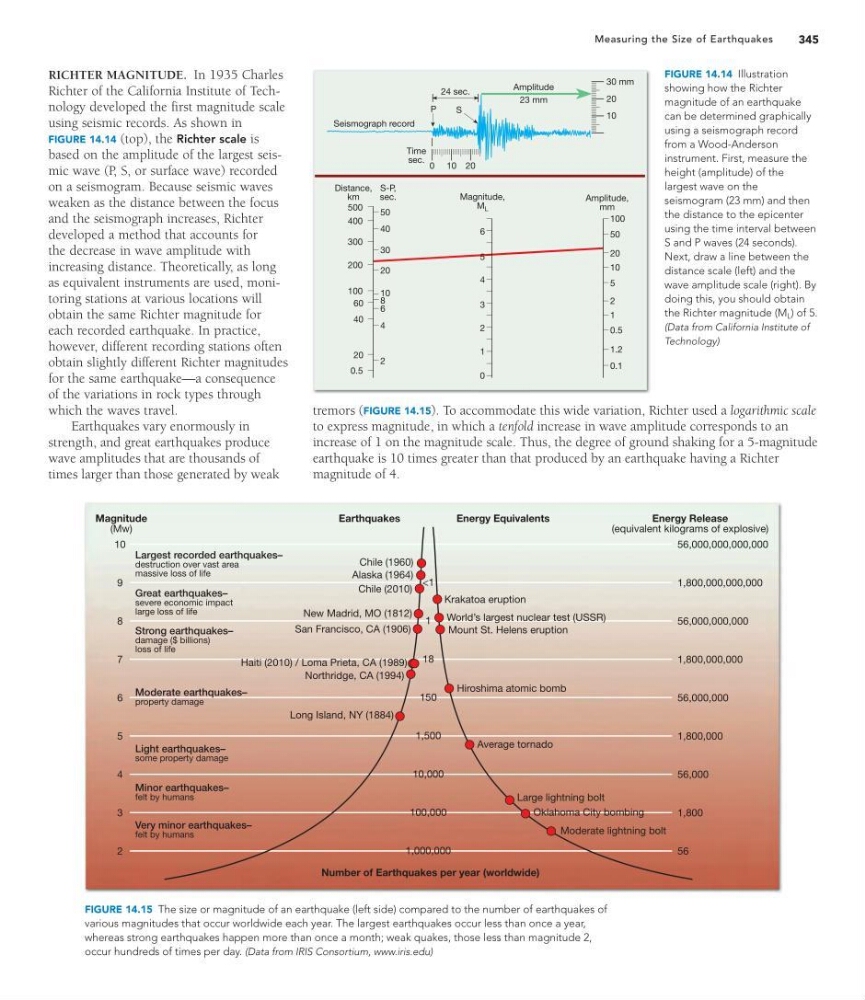
FIGURE 14.14 Illustration
showing how the Richter
magnitude of an earthquake
can be determined graphically
using a seismograph record
from a Wood-Anderson
instrument. First, measure the
height (amplitude) of the
largest wave on the
seismogram (23 mm) and then
the distance to the epicenter
using the time interval between
S and P waves (24 seconds).
Next, draw a line between the
distance scale (left) and the
wave amplitude scale (right). By
doing this, you should obtain
the Richter magnitude (M L ) of 5.
(Data from California Institute of
Technology)
Chile (1960)
Chile (2010)
10
9
8
7
6
5
4
3
2
56,000,000,000,000
1,800,000,000,000
56,000,000,000
1,800,000,000
56,000,000
1,800,000
56,000
1,800
56
<1
1
18
150
1,500
10,000
100,000
1,000,000
Alaska (1964)
New Madrid, MO (1812)
San Francisco, CA (1906)
Krakatoa eruption
Magnitude
(Mw)
Earthquakes
Energy Equivalents
Number of Earthquakes per year (worldwide)
Energy Release
(equivalent kilograms of explosive)
World’s largest nuclear test (USSR)
Mount St. Helens eruption
Hiroshima atomic bomb
Average tornado
Large lightning bolt
Moderate lightning bolt
Oklahoma City bombing
Haiti (2010) / Loma Prieta, CA (1989)
Northridge, CA (1994)
Long Island, NY (1884)
Largest recorded earthquakes–
destruction over vast area
massive loss of life
Great earthquakes–
severe economic impact
large loss of life
Strong earthquakes–
damage ($ billions)
loss of life
Moderate earthquakes–
property damage
Light earthquakes–
some property damage
Minor earthquakes–
felt by humans
Very minor earthquakes–
felt by humans
FIGURE 14.15 The size or magnitude of an earthquake (left side) compared to the number of earthquakes of
various magnitudes that occur worldwide each year. The largest earthquakes occur less than once a year,
whereas strong earthquakes happen more than once a month; weak quakes, those less than magnitude 2,
occur hundreds of times per day. (Data from IRIS Consortium, www.iris.edu)
tremors (FIGURE 14.15). To accommodate this wide variation, Richter used a logarithmic scale
to express magnitude, in which a tenfold increase in wave amplitude corresponds to an
increase of 1 on the magnitude scale. Thus, the degree of ground shaking for a 5-magnitude
earthquake is 10 times greater than that produced by an earthquake having a Richter
magnitude of 4.
Measuring the Size of Earthquakes
RICHTER MAGNITUDE. In 1935 Charles
Richter of the California Institute of Technology developed the first magnitude scale
using seismic records. As shown in
FIGURE 14.14 (top), the Richter scale is
based on the amplitude of the largest seismic wave (P, S, or surface wave) recorded
on a seismogram. Because seismic waves
weaken as the distance between the focus
and the seismograph increases, Richter
developed a method that accounts for
the decrease in wave amplitude with
increasing distance. Theoretically, as long
as equivalent instruments are used, monitoring stations at various locations will
obtain the same Richter magnitude for
each recorded earthquake. In practice,
however, different recording stations often
obtain slightly different Richter magnitudes
for the same earthquake—a consequence
of the variations in rock types through
which the waves travel.
Earthquakes vary enormously in
strength, and great earthquakes produce
wave amplitudes that are thousands of
times larger than those generated by weak
Seismograph record
24 sec.
0 10 20
Time
sec.
30 mm
20
10
Amplitude
23 mm
Distance,
km
S-P,
sec.
Magnitude,
M L
Amplitude,
mm
500
400
300
200
100
60
40
20
0.5
50
40
30
20
10
8
6
4
2
6
5
4
3
2
1
0
100
50
20
10
5
2
1
0.5
1.2
0.1
P
S
FIGURE 14.14 Illustration
showing how the Richter
magnitude of an earthquake
can be determined graphically
using a seismograph record
from a Wood-Anderson
instrument. First, measure the
height (amplitude) of the
largest wave on the
seismogram (23 mm) and then
the distance to the epicenter
using the time interval between
S and P waves (24 seconds).
Next, draw a line between the
distance scale (left) and the
wave amplitude scale (right). By
doing this, you should obtain
the Richter magnitude (M L ) of 5.
(Data from California Institute of
Technology)
Chile (1960)
Chile (2010)
10
9
8
7
6
5
4
3
2
56,000,000,000,000
1,800,000,000,000
56,000,000,000
1,800,000,000
56,000,000
1,800,000
56,000
1,800
56
<1
1
18
150
1,500
10,000
100,000
1,000,000
Alaska (1964)
New Madrid, MO (1812)
San Francisco, CA (1906)
Krakatoa eruption
Magnitude
(Mw)
Earthquakes
Energy Equivalents
Number of Earthquakes per year (worldwide)
Energy Release
(equivalent kilograms of explosive)
World’s largest nuclear test (USSR)
Mount St. Helens eruption
Hiroshima atomic bomb
Average tornado
Large lightning bolt
Moderate lightning bolt
Oklahoma City bombing
Haiti (2010) / Loma Prieta, CA (1989)
Northridge, CA (1994)
Long Island, NY (1884)
Largest recorded earthquakes–
destruction over vast area
massive loss of life
Great earthquakes–
severe economic impact
large loss of life
Strong earthquakes–
damage ($ billions)
loss of life
Moderate earthquakes–
property damage
Light earthquakes–
some property damage
Minor earthquakes–
felt by humans
Very minor earthquakes–
felt by humans
FIGURE 14.15 The size or magnitude of an earthquake (left side) compared to the number of earthquakes of
various magnitudes that occur worldwide each year. The largest earthquakes occur less than once a year,
whereas strong earthquakes happen more than once a month; weak quakes, those less than magnitude 2,
occur hundreds of times per day. (Data from IRIS Consortium, www.iris.edu)
tremors (FIGURE 14.15). To accommodate this wide variation, Richter used a logarithmic scale
to express magnitude, in which a tenfold increase in wave amplitude corresponds to an
increase of 1 on the magnitude scale. Thus, the degree of ground shaking for a 5-magnitude
earthquake is 10 times greater than that produced by an earthquake having a Richter
magnitude of 4.