

48
3 PARTICLES, PORES, AND PERMEABILITY
applies when the settling particles are perfect spheres. Most quartz grains actually approach an ovoid shape. Furthermore, a typical sand sample may contain not only ovoid
quartz, but also heavy mineral euhedra, mica flakes, and irregular clay floccules. Bioclastic sediments are still more complex. This problem has led to the idea of "hydraulic
equivalence" (Briggs et al., 1962). Hydraulically equivalent particles are those that settle
out of a column of water at the same speed. Hydraulic equivalence thus takes into account particle density, volume, and shape. This is an important point to consider in any
analysis of sediment transportation and deposition (Hand, 1967; White and Williams,
1967). Hydraulic equivalence will be considered later in the context of placer mineral
deposits (see Section 6.3.2.2.4). A derivation for Stokes' law can be found in Krumbein
and Pettijohn (1938, p. 95). Its significance in sediment transport studies will be returned
to later (see Section 4.1).
Grain size analysis by Stokes' law involves disaggregating the sediment, dispersing
the clay fraction with an antiflocculent, and tipping it into a glass tube full of liquid. The
sediment will accumulate on the bottom in order of decreasing hydraulic equivalence,
normally gravel first and clay last. There are several methods of measuring the time of
arrival and volume of the different grades. The elutriation method is widely used because it is fast and accurate and can measure particles from granule to clay grade. It necessitates making several assumptions about the effect of particle shape and surface friction on settling velocity.
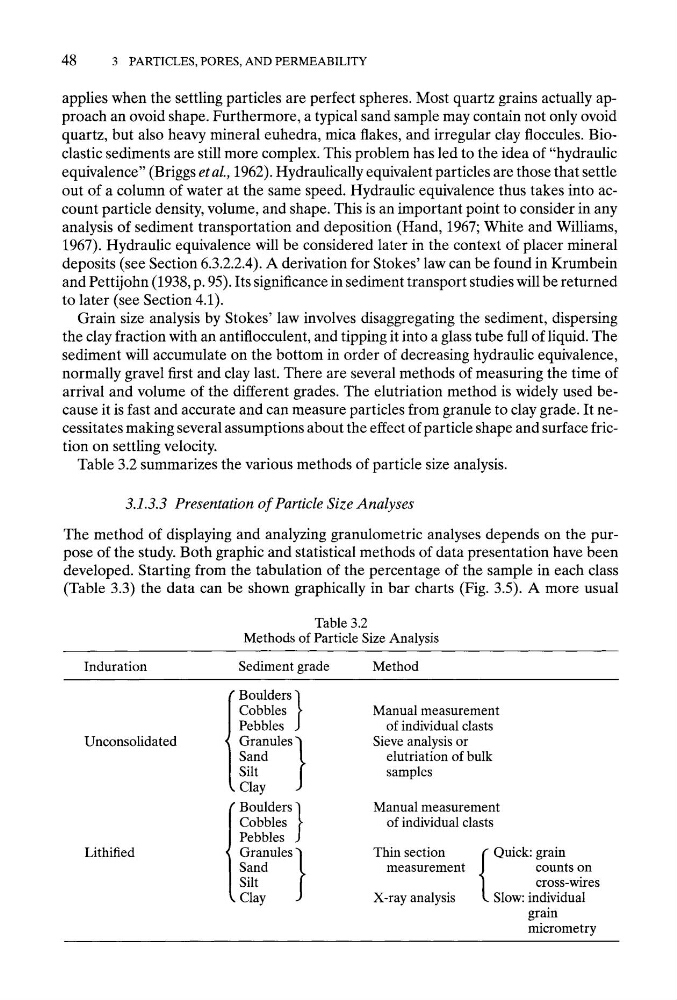
Table 3.2 summarizes the various methods of particle size analysis.
3.1.3.3 Presentation of Particle Size Analyses
The method of displaying and analyzing granulometric analyses depends on the purpose of the study. Both graphic and statistical methods of data presentation have been
developed. Starting from the tabulation of the percentage of the sample in each class
(Table 3.3) the data can be shown graphically in bar charts (Fig. 3.5). A more usual
Table 3.2
Methods of Particle Size Analysis
Induration
Sediment grade
Method
Unconsolidated
Lithified
Boulders }
Cobbles
Pebbles
Granules }
Sand
Silt
Clay
Boulders )
Cobbles
Pebbles
Granules }
Sand
Silt
Clay
Manual measurement
of individual clasts
Sieve analysis or
elutriation of bulk
samples
Manual measurement
of individual clasts
Thin section
measurement
X-ray analysis
Quick: grain
counts on
cross-wires
Slow: individual
grain
micrometry
3 PARTICLES, PORES, AND PERMEABILITY
applies when the settling particles are perfect spheres. Most quartz grains actually approach an ovoid shape. Furthermore, a typical sand sample may contain not only ovoid
quartz, but also heavy mineral euhedra, mica flakes, and irregular clay floccules. Bioclastic sediments are still more complex. This problem has led to the idea of "hydraulic
equivalence" (Briggs et al., 1962). Hydraulically equivalent particles are those that settle
out of a column of water at the same speed. Hydraulic equivalence thus takes into account particle density, volume, and shape. This is an important point to consider in any
analysis of sediment transportation and deposition (Hand, 1967; White and Williams,
1967). Hydraulic equivalence will be considered later in the context of placer mineral
deposits (see Section 6.3.2.2.4). A derivation for Stokes' law can be found in Krumbein
and Pettijohn (1938, p. 95). Its significance in sediment transport studies will be returned
to later (see Section 4.1).
Grain size analysis by Stokes' law involves disaggregating the sediment, dispersing
the clay fraction with an antiflocculent, and tipping it into a glass tube full of liquid. The
sediment will accumulate on the bottom in order of decreasing hydraulic equivalence,
normally gravel first and clay last. There are several methods of measuring the time of
arrival and volume of the different grades. The elutriation method is widely used because it is fast and accurate and can measure particles from granule to clay grade. It necessitates making several assumptions about the effect of particle shape and surface friction on settling velocity.
Table 3.2 summarizes the various methods of particle size analysis.
3.1.3.3 Presentation of Particle Size Analyses
The method of displaying and analyzing granulometric analyses depends on the purpose of the study. Both graphic and statistical methods of data presentation have been
developed. Starting from the tabulation of the percentage of the sample in each class
(Table 3.3) the data can be shown graphically in bar charts (Fig. 3.5). A more usual
Table 3.2
Methods of Particle Size Analysis
Induration
Sediment grade
Method
Unconsolidated
Lithified
Boulders }
Cobbles
Pebbles
Granules }
Sand
Silt
Clay
Boulders )
Cobbles
Pebbles
Granules }
Sand
Silt
Clay
Manual measurement
of individual clasts
Sieve analysis or
elutriation of bulk
samples
Manual measurement
of individual clasts
Thin section
measurement
X-ray analysis
Quick: grain
counts on
cross-wires
Slow: individual
grain
micrometry