

46
3 PARTICLES, PORES, AND PERMEABILITY
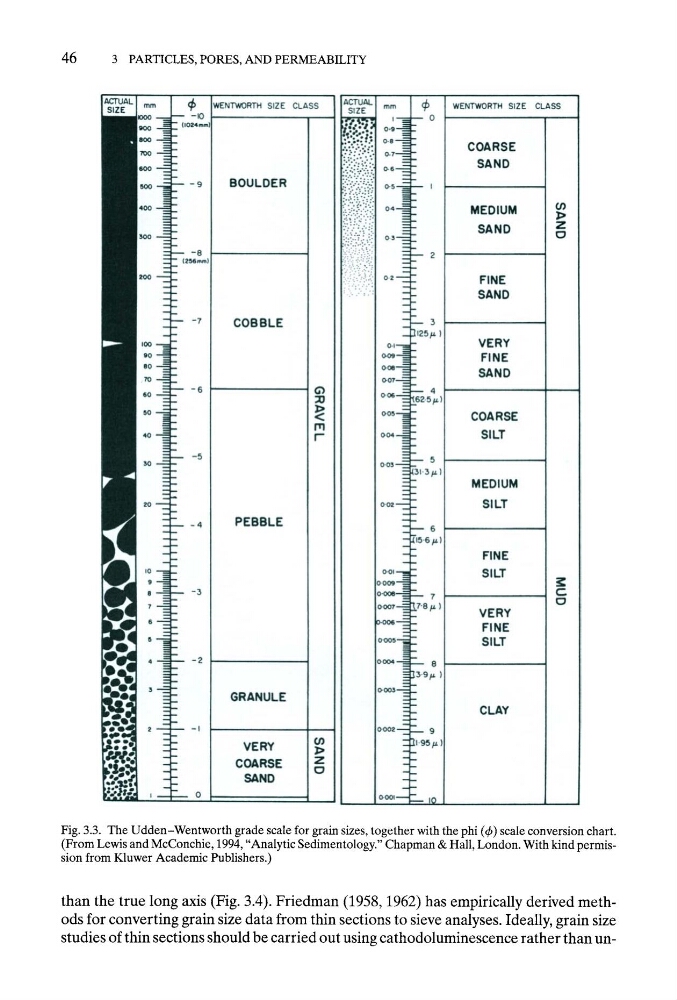
Fig. 3.3. The Udden-Wentworth grade scale for grain sizes, together with the phi (~b) scale conversion chart.
(From Lewis and McConchie, 1994, "Analytic Sedimentology." Chapman & Hall, London. With kind permission from Kluwer Academic Publishers.)
than the true long axis (Fig. 3.4). Friedman (1958, 1962) has empirically derived methods for converting grain size data from thin sections to sieve analyses. Ideally, grain size
studies of thin sections should be carried out using cathodoluminescence rather than un-
3 PARTICLES, PORES, AND PERMEABILITY
Fig. 3.3. The Udden-Wentworth grade scale for grain sizes, together with the phi (~b) scale conversion chart.
(From Lewis and McConchie, 1994, "Analytic Sedimentology." Chapman & Hall, London. With kind permission from Kluwer Academic Publishers.)
than the true long axis (Fig. 3.4). Friedman (1958, 1962) has empirically derived methods for converting grain size data from thin sections to sieve analyses. Ideally, grain size
studies of thin sections should be carried out using cathodoluminescence rather than un-