

8.3 MUDROCKS
339
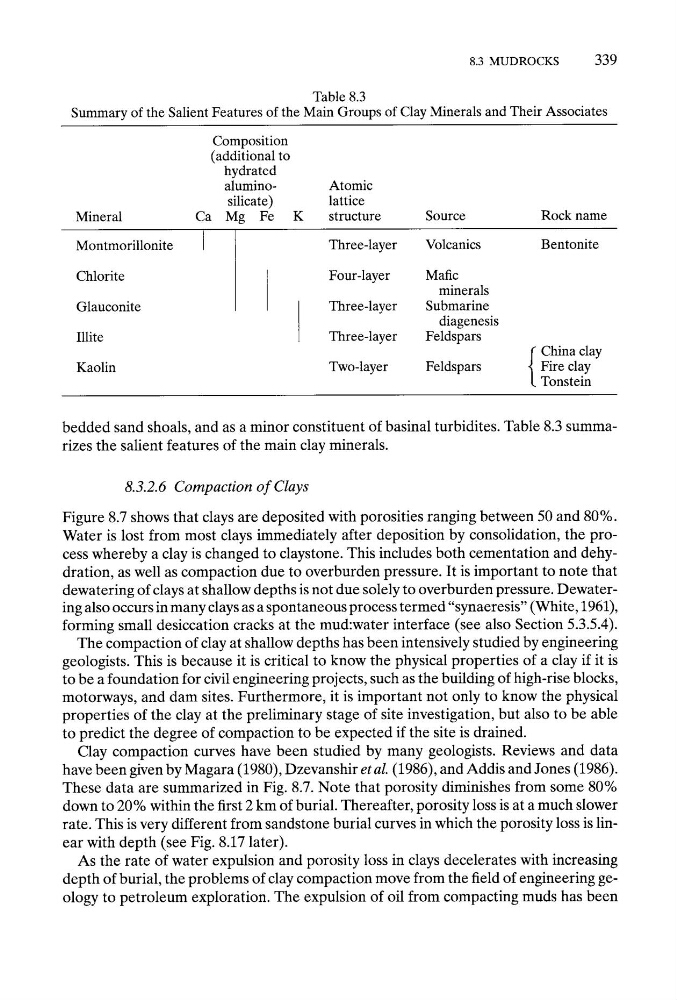
Table 8.3
Summary of the Salient Features of the Main Groups of Clay Minerals and Their Associates
Composition
(additional to
hydrated
aluminoAtomic
silicate)
lattice
Mineral
Ca Mg Fe K
structure
Source
Rock name
Montmorillonite
Chlorite
Glauconite
Illite
Three-layer
Volcanics
Bentonite
Four-layer
Mafic
minerals
Three-layer
Submarine
diagenesis
Three-layer
Feldspars
Kaolin
Two-layer
Feldspars
{
~ China clay
Fire clay
Tonstein
bedded sand shoals, and as a minor constituent of basinal turbidites. Table 8.3 summarizes the salient features of the main clay minerals.
8.3.2.6 Compaction of Clays
Figure 8.7 shows that clays are deposited with porosities ranging between 50 and 80%.
Water is lost from most clays immediately after deposition by consolidation, the process whereby a clay is changed to claystone. This includes both cementation and dehydration, as well as compaction due to overburden pressure. It is important to note that
dewatering of clays at shallow depths is not due solely to overburden pressure. Dewatering also occurs in many clays as a spontaneous process termed "synaeresis" (White, 1961),
forming small desiccation cracks at the mud:water interface (see also Section 5.3.5.4).
The compaction of clay at shallow depths has been intensively studied by engineering
geologists. This is because it is critical to know the physical properties of a clay if it is
to be a foundation for civil engineering projects, such as the building of high-rise blocks,
motorways, and dam sites. Furthermore, it is important not only to know the physical
properties of the clay at the preliminary stage of site investigation, but also to be able
to predict the degree of compaction to be expected if the site is drained.
Clay compaction curves have been studied by many geologists. Reviews and data
have been given by Magara (1980), Dzevanshir et al. (1986), and Addis and Jones (1986).
These data are summarized in Fig. 8.7. Note that porosity diminishes from some 80%
down to 20% within the first 2 km of burial. Thereafter, porosity loss is at a much slower
rate. This is very different from sandstone burial curves in which the porosity loss is linear with depth (see Fig. 8.17 later).
As the rate of water expulsion and porosity loss in clays decelerates with increasing
depth of burial, the problems of clay compaction move from the field of engineering geology to petroleum exploration. The expulsion of oil from compacting muds has been
339
Table 8.3
Summary of the Salient Features of the Main Groups of Clay Minerals and Their Associates
Composition
(additional to
hydrated
aluminoAtomic
silicate)
lattice
Mineral
Ca Mg Fe K
structure
Source
Rock name
Montmorillonite
Chlorite
Glauconite
Illite
Three-layer
Volcanics
Bentonite
Four-layer
Mafic
minerals
Three-layer
Submarine
diagenesis
Three-layer
Feldspars
Kaolin
Two-layer
Feldspars
{
~ China clay
Fire clay
Tonstein
bedded sand shoals, and as a minor constituent of basinal turbidites. Table 8.3 summarizes the salient features of the main clay minerals.
8.3.2.6 Compaction of Clays
Figure 8.7 shows that clays are deposited with porosities ranging between 50 and 80%.
Water is lost from most clays immediately after deposition by consolidation, the process whereby a clay is changed to claystone. This includes both cementation and dehydration, as well as compaction due to overburden pressure. It is important to note that
dewatering of clays at shallow depths is not due solely to overburden pressure. Dewatering also occurs in many clays as a spontaneous process termed "synaeresis" (White, 1961),
forming small desiccation cracks at the mud:water interface (see also Section 5.3.5.4).
The compaction of clay at shallow depths has been intensively studied by engineering
geologists. This is because it is critical to know the physical properties of a clay if it is
to be a foundation for civil engineering projects, such as the building of high-rise blocks,
motorways, and dam sites. Furthermore, it is important not only to know the physical
properties of the clay at the preliminary stage of site investigation, but also to be able
to predict the degree of compaction to be expected if the site is drained.
Clay compaction curves have been studied by many geologists. Reviews and data
have been given by Magara (1980), Dzevanshir et al. (1986), and Addis and Jones (1986).
These data are summarized in Fig. 8.7. Note that porosity diminishes from some 80%
down to 20% within the first 2 km of burial. Thereafter, porosity loss is at a much slower
rate. This is very different from sandstone burial curves in which the porosity loss is linear with depth (see Fig. 8.17 later).
As the rate of water expulsion and porosity loss in clays decelerates with increasing
depth of burial, the problems of clay compaction move from the field of engineering geology to petroleum exploration. The expulsion of oil from compacting muds has been