

170
5 SEDIMENTARY STRUCTURES
3O
03
O
r
9
- 20
0
6
Z
I0
Cector mea n
ip- direction
0
90
180
270
0
30
I
i
.... l
, __-}
Azimuths (45 ~ classes)
Histogram
Compass rose (45 ~ class intervals )
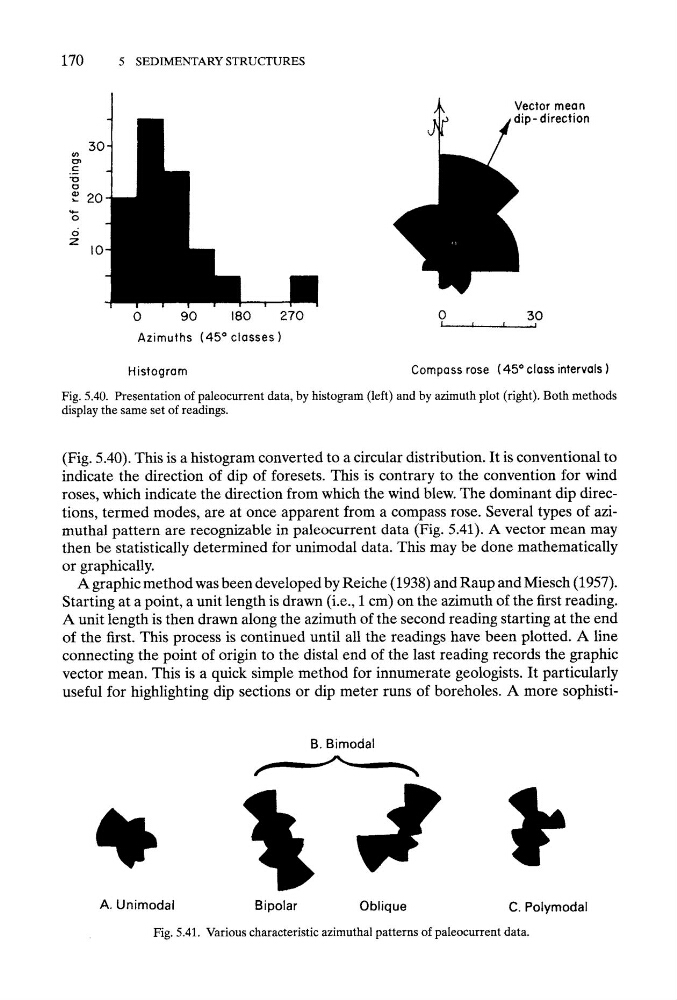
Fig. 5.40. Presentation of paleocurrent data, by histogram (left) and by azimuth plot (right). Both methods
display the same set of readings.
(Fig. 5.40). This is a histogram converted to a circular distribution. It is conventional to
indicate the direction of dip of foresets. This is contrary to the convention for wind
roses, which indicate the direction from which the wind blew. The dominant dip directions, termed modes, are at once apparent from a compass rose. Several types of azimuthal pattern are recognizable in paleocurrent data (Fig. 5.41). A vector mean may
then be statistically determined for unimodal data. This may be done mathematically
or graphically.
A graphic method was been developed by Reiche (1938) and Raup and Miesch (1957).
Starting at a point, a unit length is drawn (i.e., 1 cm) on the azimuth of the first reading.
A unit length is then drawn along the azimuth of the second reading starting at the end
of the first. This process is continued until all the readings have been plotted. A line
connecting the point of origin to the distal end of the last reading records the graphic
vector mean. This is a quick simple method for innumerate geologists. It particularly
useful for highlighting dip sections or dip meter runs of boreholes. A more sophistiB. Bimodal
A. Unimodal
Bipolar
Oblique
C. Polymodal
Fig. 5.41. Various characteristic azimuthal patterns of pa]eocurrent data.
5 SEDIMENTARY STRUCTURES
3O
03
O
r
9
- 20
0
6
Z
I0
Cector mea n
ip- direction
0
90
180
270
0
30
I
i
.... l
, __-}
Azimuths (45 ~ classes)
Histogram
Compass rose (45 ~ class intervals )
Fig. 5.40. Presentation of paleocurrent data, by histogram (left) and by azimuth plot (right). Both methods
display the same set of readings.
(Fig. 5.40). This is a histogram converted to a circular distribution. It is conventional to
indicate the direction of dip of foresets. This is contrary to the convention for wind
roses, which indicate the direction from which the wind blew. The dominant dip directions, termed modes, are at once apparent from a compass rose. Several types of azimuthal pattern are recognizable in paleocurrent data (Fig. 5.41). A vector mean may
then be statistically determined for unimodal data. This may be done mathematically
or graphically.
A graphic method was been developed by Reiche (1938) and Raup and Miesch (1957).
Starting at a point, a unit length is drawn (i.e., 1 cm) on the azimuth of the first reading.
A unit length is then drawn along the azimuth of the second reading starting at the end
of the first. This process is continued until all the readings have been plotted. A line
connecting the point of origin to the distal end of the last reading records the graphic
vector mean. This is a quick simple method for innumerate geologists. It particularly
useful for highlighting dip sections or dip meter runs of boreholes. A more sophistiB. Bimodal
A. Unimodal
Bipolar
Oblique
C. Polymodal
Fig. 5.41. Various characteristic azimuthal patterns of pa]eocurrent data.