

Nutrient Distribution and the Consequences of Differing Supply Ratios
77
These are, of course, the “geostrophic nitrate ridges” of Yentsch (1990), and analogous
features exist in the silicate and phosphate fields. Yentsch appears to have been the first
to have noticed the consequences of the fact that (in his words) the surfaces “of equal
nitrate are bowed sharply upwards between latitudes 10–20
N and 40–50
N” in the North
Atlantic. He went on to remark that these baroclinic features reflect the geostrophic,
westward flow of the equatorial currents at lower latitudes and of the west wind drift at
higher latitudes. For a more comprehensive description of this phenomenon, consult the
WOA 1991, or Gruber and Sarmiento (2002).
It will not have escaped your notice that each of the three “classical” high-S regions
lies above one of Yentsch’s nitrate ridges: in the subarctic Pacific, in the eastern tropical
Pacific, and around the Southern Ocean. What you may not have noticed is that above
the nitrate ridge of the northern Atlantic, which is somewhat atypical because of the open
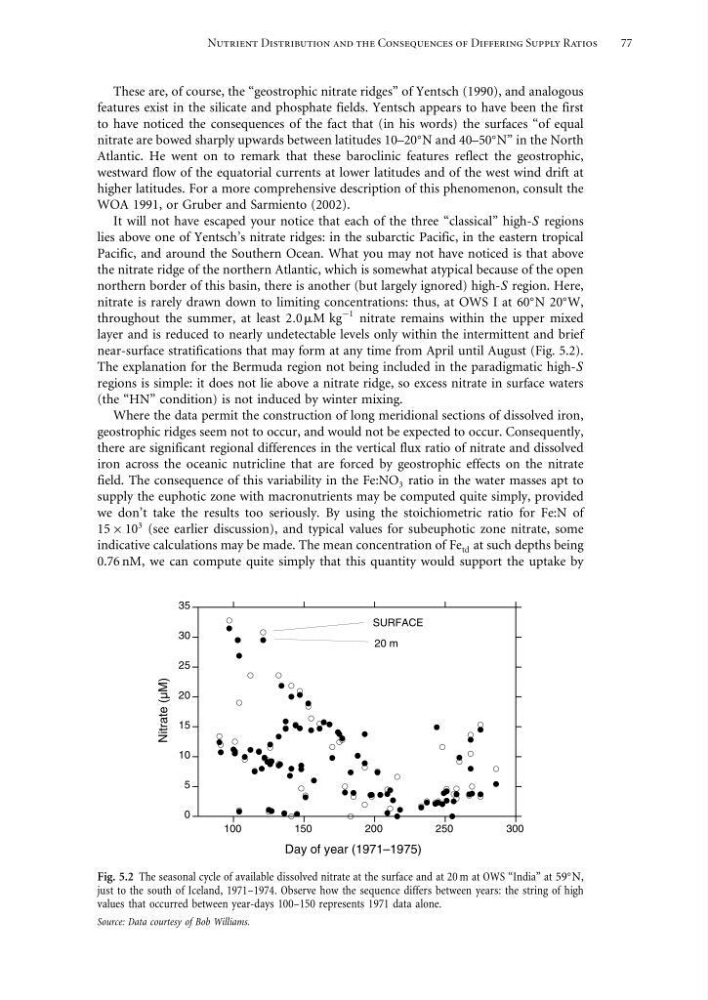
northern border of this basin, there is another (but largely ignored) high-S region. Here,
nitrate is rarely drawn down to limiting concentrations: thus, at OWS I at 60
N 20
W,
throughout the summer, at least 20 M kg
−1 nitrate remains within the upper mixed
layer and is reduced to nearly undetectable levels only within the intermittent and brief
near-surface stratifications that may form at any time from April until August (Fig. 5.2).
The explanation for the Bermuda region not being included in the paradigmatic high-S
regions is simple: it does not lie above a nitrate ridge, so excess nitrate in surface waters
(the “HN” condition) is not induced by winter mixing.
Where the data permit the construction of long meridional sections of dissolved iron,
geostrophic ridges seem not to occur, and would not be expected to occur. Consequently,
there are significant regional differences in the vertical flux ratio of nitrate and dissolved
iron across the oceanic nutricline that are forced by geostrophic effects on the nitrate
field. The consequence of this variability in the Fe:NO 3 ratio in the water masses apt to
supply the euphotic zone with macronutrients may be computed quite simply, provided
we don’t take the results too seriously. By using the stoichiometric ratio for Fe:N of
15 × 10
3 (see earlier discussion), and typical values for subeuphotic zone nitrate, some
indicative calculations may be made. The mean concentration of Fe td at such depths being
0.76 nM, we can compute quite simply that this quantity would support the uptake by
0
5
10
15
20
25
30
35
100
150
200
250
300
Nitrate (µM)
Day of year (1971–1975)
SURFACE
20 m
Fig. 5.2 The seasonal cycle of available dissolved nitrate at the surface and at 20 m at OWS “India” at 59
N,
just to the south of Iceland, 1971–1974. Observe how the sequence differs between years: the string of high
values that occurred between year-days 100–150 represents 1971 data alone.
Source: Data courtesy of Bob Williams.
77
These are, of course, the “geostrophic nitrate ridges” of Yentsch (1990), and analogous
features exist in the silicate and phosphate fields. Yentsch appears to have been the first
to have noticed the consequences of the fact that (in his words) the surfaces “of equal
nitrate are bowed sharply upwards between latitudes 10–20
N and 40–50
N” in the North
Atlantic. He went on to remark that these baroclinic features reflect the geostrophic,
westward flow of the equatorial currents at lower latitudes and of the west wind drift at
higher latitudes. For a more comprehensive description of this phenomenon, consult the
WOA 1991, or Gruber and Sarmiento (2002).
It will not have escaped your notice that each of the three “classical” high-S regions
lies above one of Yentsch’s nitrate ridges: in the subarctic Pacific, in the eastern tropical
Pacific, and around the Southern Ocean. What you may not have noticed is that above
the nitrate ridge of the northern Atlantic, which is somewhat atypical because of the open
northern border of this basin, there is another (but largely ignored) high-S region. Here,
nitrate is rarely drawn down to limiting concentrations: thus, at OWS I at 60
N 20
W,
throughout the summer, at least 20 M kg
−1 nitrate remains within the upper mixed
layer and is reduced to nearly undetectable levels only within the intermittent and brief
near-surface stratifications that may form at any time from April until August (Fig. 5.2).
The explanation for the Bermuda region not being included in the paradigmatic high-S
regions is simple: it does not lie above a nitrate ridge, so excess nitrate in surface waters
(the “HN” condition) is not induced by winter mixing.
Where the data permit the construction of long meridional sections of dissolved iron,
geostrophic ridges seem not to occur, and would not be expected to occur. Consequently,
there are significant regional differences in the vertical flux ratio of nitrate and dissolved
iron across the oceanic nutricline that are forced by geostrophic effects on the nitrate
field. The consequence of this variability in the Fe:NO 3 ratio in the water masses apt to
supply the euphotic zone with macronutrients may be computed quite simply, provided
we don’t take the results too seriously. By using the stoichiometric ratio for Fe:N of
15 × 10
3 (see earlier discussion), and typical values for subeuphotic zone nitrate, some
indicative calculations may be made. The mean concentration of Fe td at such depths being
0.76 nM, we can compute quite simply that this quantity would support the uptake by
0
5
10
15
20
25
30
35
100
150
200
250
300
Nitrate (µM)
Day of year (1971–1975)
SURFACE
20 m
Fig. 5.2 The seasonal cycle of available dissolved nitrate at the surface and at 20 m at OWS “India” at 59
N,
just to the south of Iceland, 1971–1974. Observe how the sequence differs between years: the string of high
values that occurred between year-days 100–150 represents 1971 data alone.
Source: Data courtesy of Bob Williams.