

76
Chapter 5: Nutrient Limitation: The Example of Iron
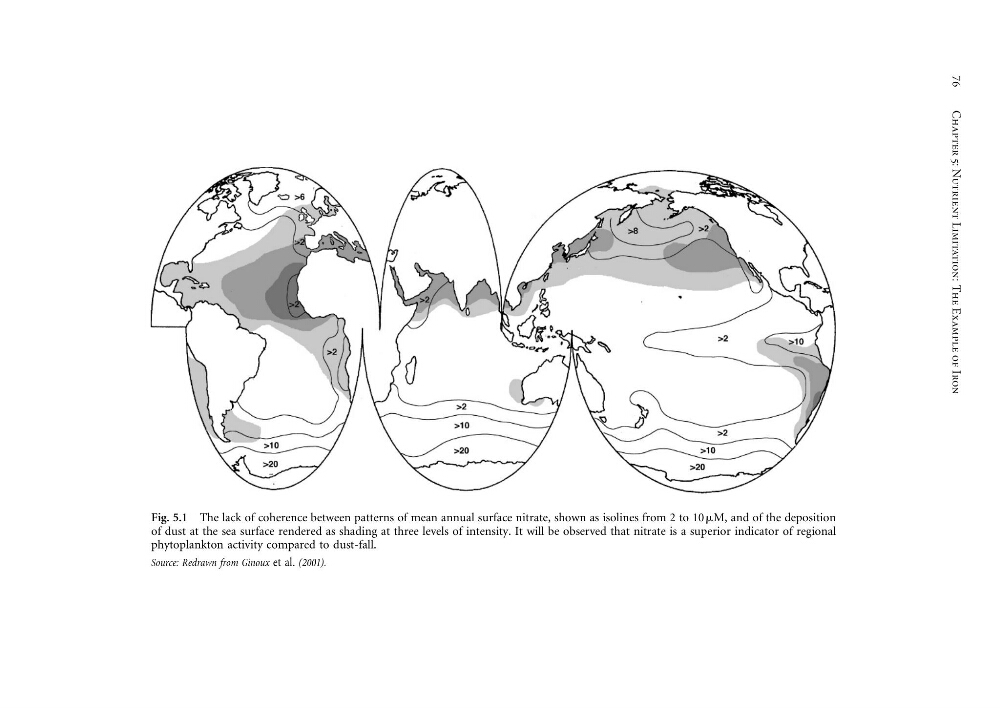
Fig. 5.1 The lack of coherence between patterns of mean annual surface nitrate, shown as isolines from 2 to 10 M, and of the deposition
of dust at the sea surface rendered as shading at three levels of intensity. It will be observed that nitrate is a superior indicator of regional
phytoplankton activity compared to dust-fall.
Source: Redrawn from Ginoux et al. (2001).
Chapter 5: Nutrient Limitation: The Example of Iron
Fig. 5.1 The lack of coherence between patterns of mean annual surface nitrate, shown as isolines from 2 to 10 M, and of the deposition
of dust at the sea surface rendered as shading at three levels of intensity. It will be observed that nitrate is a superior indicator of regional
phytoplankton activity compared to dust-fall.
Source: Redrawn from Ginoux et al. (2001).