

60
Chapter 4: Physical Control of Ecological Processes
sections, which run down the Greenwich meridian, and in the “Atlantic Western Basins”
sections. In all these, part of the SEC (4
N to 8
S) and the entire South Equatorial
Countercurrent 8–12
S lie equatorward of the abrupt transition from weak subtropical
to strong tropical pycnoclines; the poleward part of the SEC (from 12
S to 23
S) exhibits
a relatively weak pycnocline.
The Brunt-Väisälä frequency takes higher values in the east than in the west of each
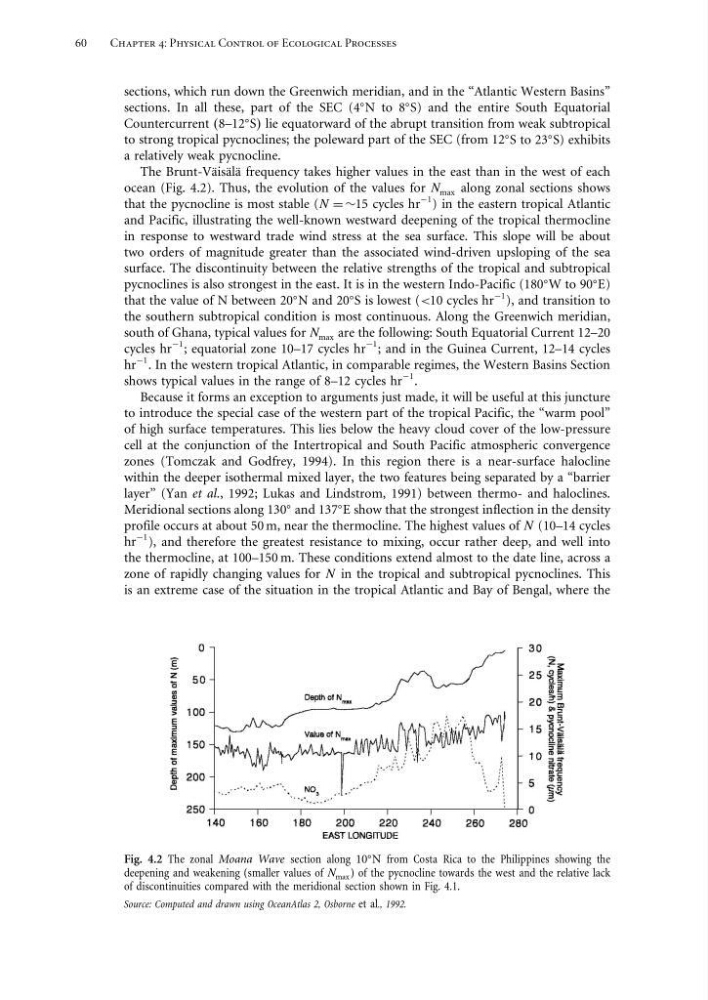
ocean (Fig. 4.2). Thus, the evolution of the values for N max along zonal sections shows
that the pycnocline is most stable (N = ∼15 cycles hr
−1 ) in the eastern tropical Atlantic
and Pacific, illustrating the well-known westward deepening of the tropical thermocline
in response to westward trade wind stress at the sea surface. This slope will be about
two orders of magnitude greater than the associated wind-driven upsloping of the sea
surface. The discontinuity between the relative strengths of the tropical and subtropical
pycnoclines is also strongest in the east. It is in the western Indo-Pacific (180
W to 90
E)
that the value of N between 20
N and 20
S is lowest (<10 cycles hr
−1 ), and transition to
the southern subtropical condition is most continuous. Along the Greenwich meridian,
south of Ghana, typical values for N max are the following: South Equatorial Current 12–20
cycles hr
−1 ; equatorial zone 10–17 cycles hr
−1 ; and in the Guinea Current, 12–14 cycles
hr
−1 . In the western tropical Atlantic, in comparable regimes, the Western Basins Section
shows typical values in the range of 8–12 cycles hr
−1 .
Because it forms an exception to arguments just made, it will be useful at this juncture
to introduce the special case of the western part of the tropical Pacific, the “warm pool”
of high surface temperatures. This lies below the heavy cloud cover of the low-pressure
cell at the conjunction of the Intertropical and South Pacific atmospheric convergence
zones (Tomczak and Godfrey, 1994). In this region there is a near-surface halocline
within the deeper isothermal mixed layer, the two features being separated by a “barrier
layer” (Yan et al., 1992; Lukas and Lindstrom, 1991) between thermo- and haloclines.
Meridional sections along 130
and 137
E show that the strongest inflection in the density
profile occurs at about 50 m, near the thermocline. The highest values of N (10–14 cycles
hr
−1 ), and therefore the greatest resistance to mixing, occur rather deep, and well into
the thermocline, at 100–150 m. These conditions extend almost to the date line, across a
zone of rapidly changing values for N in the tropical and subtropical pycnoclines. This
is an extreme case of the situation in the tropical Atlantic and Bay of Bengal, where the
Fig. 4.2 The zonal Moana Wave section along 10
N from Costa Rica to the Philippines showing the
deepening and weakening (smaller values of N max ) of the pycnocline towards the west and the relative lack
of discontinuities compared with the meridional section shown in Fig. 4.1.
Source: Computed and drawn using OceanAtlas 2, Osborne et al., 1992.
Chapter 4: Physical Control of Ecological Processes
sections, which run down the Greenwich meridian, and in the “Atlantic Western Basins”
sections. In all these, part of the SEC (4
N to 8
S) and the entire South Equatorial
Countercurrent 8–12
S lie equatorward of the abrupt transition from weak subtropical
to strong tropical pycnoclines; the poleward part of the SEC (from 12
S to 23
S) exhibits
a relatively weak pycnocline.
The Brunt-Väisälä frequency takes higher values in the east than in the west of each
ocean (Fig. 4.2). Thus, the evolution of the values for N max along zonal sections shows
that the pycnocline is most stable (N = ∼15 cycles hr
−1 ) in the eastern tropical Atlantic
and Pacific, illustrating the well-known westward deepening of the tropical thermocline
in response to westward trade wind stress at the sea surface. This slope will be about
two orders of magnitude greater than the associated wind-driven upsloping of the sea
surface. The discontinuity between the relative strengths of the tropical and subtropical
pycnoclines is also strongest in the east. It is in the western Indo-Pacific (180
W to 90
E)
that the value of N between 20
N and 20
S is lowest (<10 cycles hr
−1 ), and transition to
the southern subtropical condition is most continuous. Along the Greenwich meridian,
south of Ghana, typical values for N max are the following: South Equatorial Current 12–20
cycles hr
−1 ; equatorial zone 10–17 cycles hr
−1 ; and in the Guinea Current, 12–14 cycles
hr
−1 . In the western tropical Atlantic, in comparable regimes, the Western Basins Section
shows typical values in the range of 8–12 cycles hr
−1 .
Because it forms an exception to arguments just made, it will be useful at this juncture
to introduce the special case of the western part of the tropical Pacific, the “warm pool”
of high surface temperatures. This lies below the heavy cloud cover of the low-pressure
cell at the conjunction of the Intertropical and South Pacific atmospheric convergence
zones (Tomczak and Godfrey, 1994). In this region there is a near-surface halocline
within the deeper isothermal mixed layer, the two features being separated by a “barrier
layer” (Yan et al., 1992; Lukas and Lindstrom, 1991) between thermo- and haloclines.
Meridional sections along 130
and 137
E show that the strongest inflection in the density
profile occurs at about 50 m, near the thermocline. The highest values of N (10–14 cycles
hr
−1 ), and therefore the greatest resistance to mixing, occur rather deep, and well into
the thermocline, at 100–150 m. These conditions extend almost to the date line, across a
zone of rapidly changing values for N in the tropical and subtropical pycnoclines. This
is an extreme case of the situation in the tropical Atlantic and Bay of Bengal, where the
Fig. 4.2 The zonal Moana Wave section along 10
N from Costa Rica to the Philippines showing the
deepening and weakening (smaller values of N max ) of the pycnocline towards the west and the relative lack
of discontinuities compared with the meridional section shown in Fig. 4.1.
Source: Computed and drawn using OceanAtlas 2, Osborne et al., 1992.